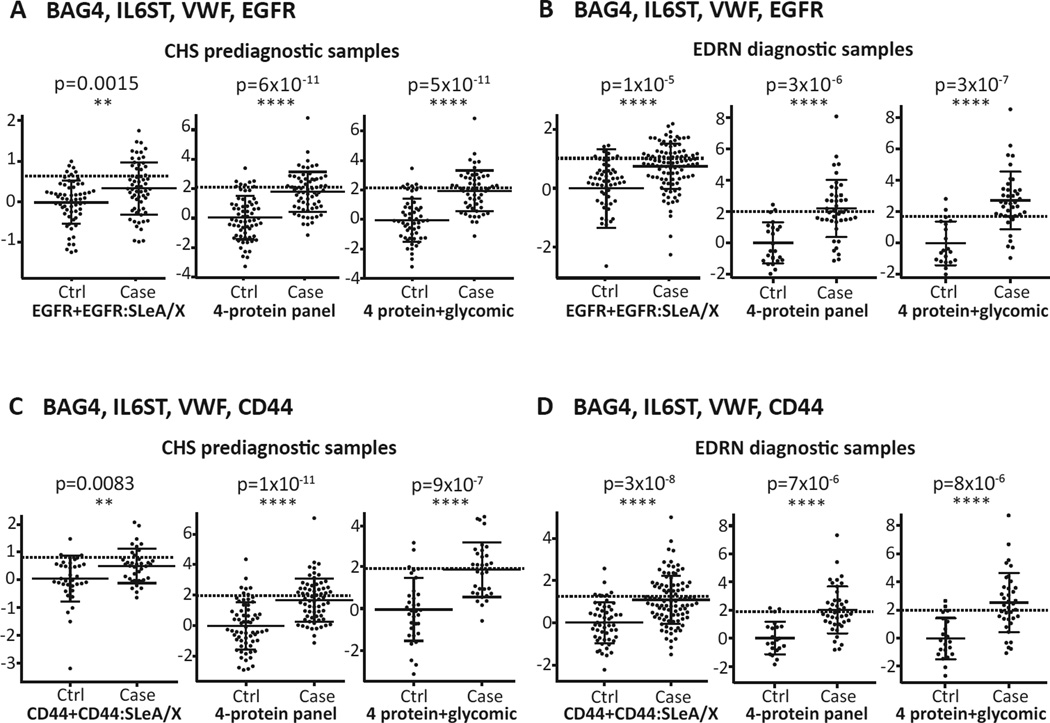
Figure 6. Performance of EGFR and CD44 sialyl Lewis-A and -X glycan markers in prediagnostic and diagnostic sets of plasma.
(A–D left graphs) Plots for the predictive index of EGFR or CD44 protein and EGFR- or CD44-sialyl Lewis-A and -X glycan levels. (A–D middle graphs) Case predictive index of the 4-marker panels. (A–D right graphs) Predictive index after addition of EGFR or CD44-glycan to the 4-marker panels. The dotted line represents 90% specificity. Statistical significance: **, p<0.01; ***, p<0.001; ****, p<0.0001. BAG4, BAG family molecular chaperone regulator 4; CHS, Cardiovascular Health Study; EDRN, Early Detection Research Network; IL6ST, interleukin-6 receptor subunit beta; VWF, von Willebrand factor.

