FIGURE 2.

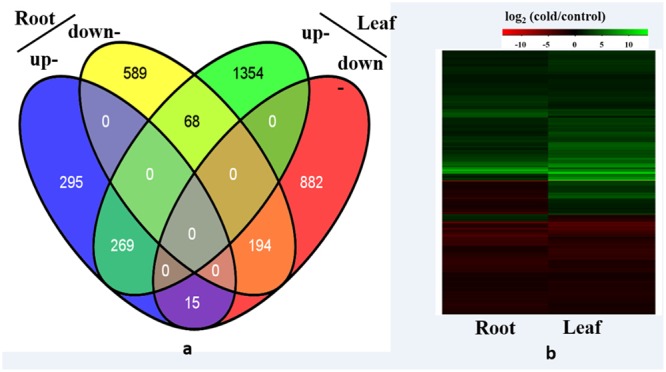
Differentially expressed genes analysis. (a) Venn diagram demonstrated the common and specific differentially expressed genes (DEGs) in roots and leaves, (b) Heat map demonstrated the expression profile DEGs in roots and leaves.

Differentially expressed genes analysis. (a) Venn diagram demonstrated the common and specific differentially expressed genes (DEGs) in roots and leaves, (b) Heat map demonstrated the expression profile DEGs in roots and leaves.