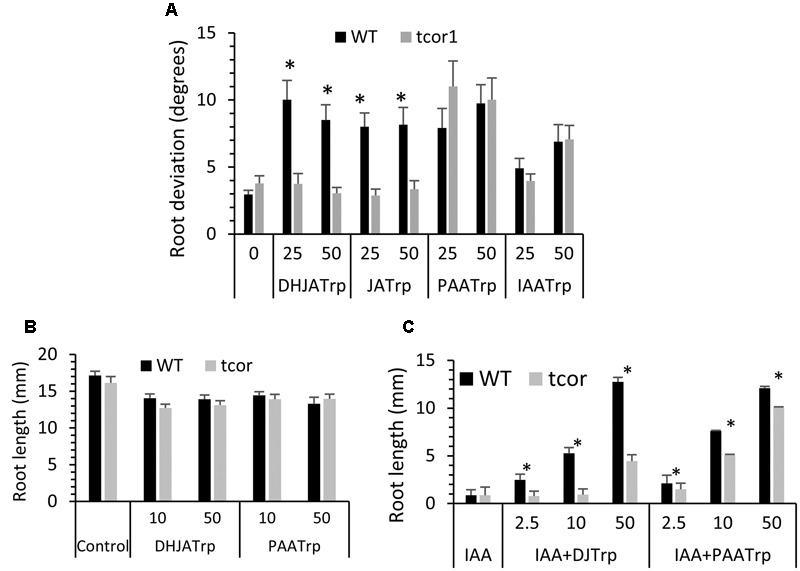
FIGURE 4.

Response of tcor1-D to Trp conjugates. (A) Agravitropic response to conjugates at the indicated concentrations (μM). Growth conditions were the same as for Figure 1. (B) Seedling primary root length after 6 days growth on indicated conjugates (μM). (C) Same conditions as B but with 2 μM IAA included in medium for all tests. Values are means with SE, asterisks indicate significant difference between WT and mutant pairs (t-test, p < 0.01, n = 16–29).
