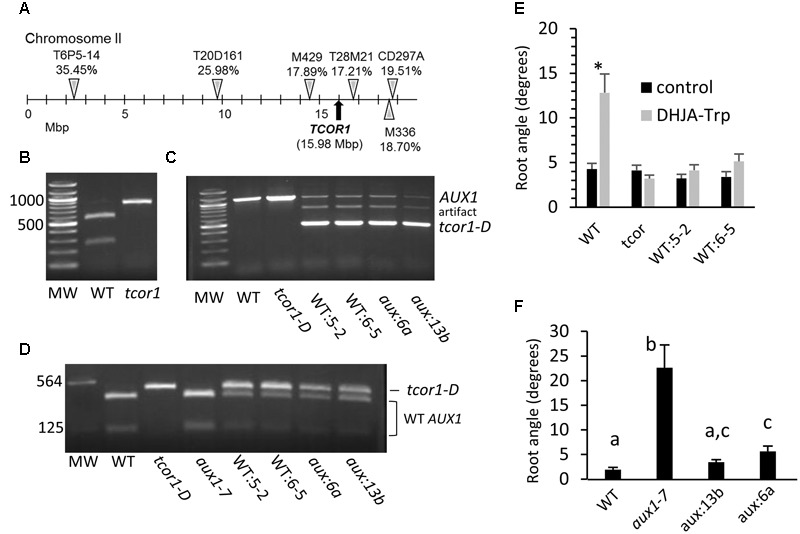
FIGURE 5.

Mapping of tcor1-D locus and transformation with the mutant AUX1 cDNA. (A) Details for the markers used are found in Supplementary Table 1. Percentages indicate proportion of recombinant chromosomes for individual markers seen among 110 to 123 F2 individuals each. (B) Genomic amplification products spanning the mutation site of the AUX1 gene after cleavage with Sal1. (C) Uncleaved amplification products of AUX1 genomic DNA from WT (WT:5-2, WT:6-5) and aux1-7 (aux:6a, aux13b) plants transformed with tcor1-D cDNA. (D) cDNA amplification products of indicated genotypes. Endogenous AUX1 wild type cDNA is cleaved by Sal1, tcor1-D cDNA transgene is not. (E) Mean root angles with SE for WT seedlings transformed with tcor1-D cDNA on control and 25 μM DHJA-Trp medium. Significant difference between treatments for each genotype indicated by an asterisk (t-tests, p < 0.05, n = 14–36 seedlings). (F) Growth of aux1-7 transformants on control medium. Means with same letters not significantly different (t-test, p ≤ 0.05, n = 17–21 seedlings).
