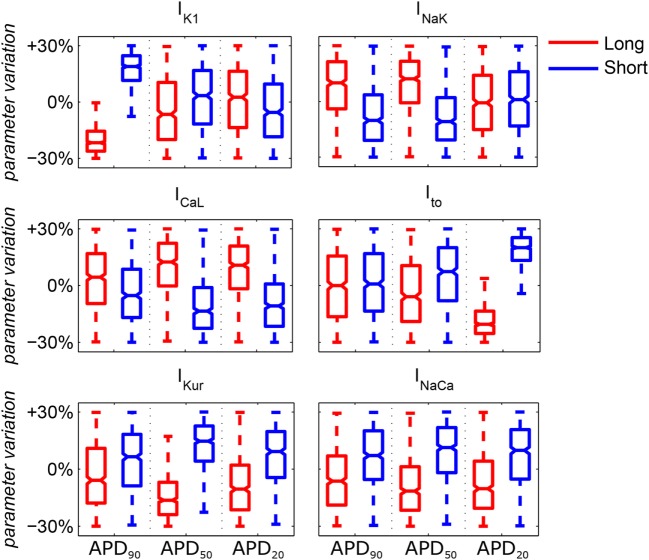
Figure 2.
Median values and ranges of variability in ionic conductances in the six subpopulations of human atrial action potential models under atrial fibrillation remodeling. Blue and red indicates short and long APD90, APD50, and APD20, respectively. Each boxplot represents the range covered by the ionic conductances: the edges of the box are the first and third quartiles, whiskers extend to the most extreme data points, the estimated median physiological value is the central horizontal line and the notch around the median is the 5% significance level.

