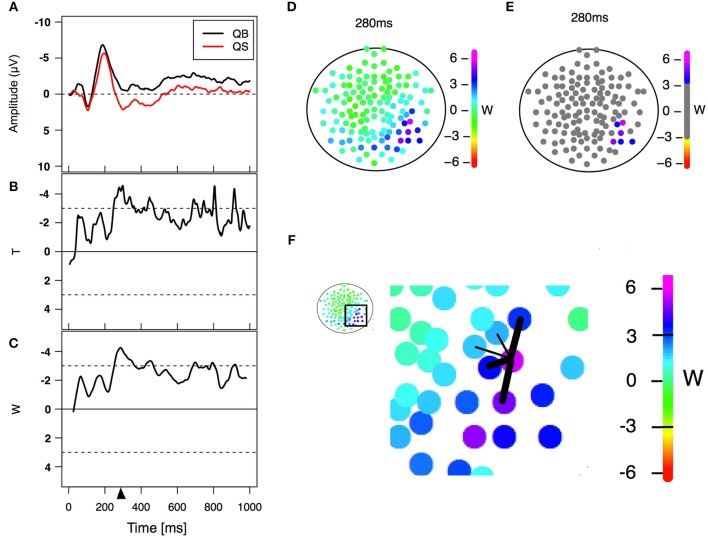
Figure 2.
Statistical analysis. (A) Example of an event-related potential obtained in two different PLD conditions in a particular electrode. (B) Paired T-statistics as a function of time for comparing both PLD conditions on the same electrode. (C) W-statistics as a function of time, computed as a time average of the T-statistics over a time windows of 21 points/42 ms (Equation 1). The triangle refers to a specific time point (280 ms in this case) corresponding to the center of the window of 21 points/42 ms width (left lower panel) used for statistical analysis. (D) W-statistics plotted in a topological distribution map for time equal 280 ms. Each colored electrode depicts its particular W-value. (E) Electrodes are considered to have a significant difference between conditions if |W|>3 and a similar behavior is observed in their spatial neighborhood (Equation 2). (F) Scheme showing an example of the spatial neighbors' criterion. The five nearest neighbors are selected and the average of the three largest |W| values (thick links) is computed. If the values Wneig and |W| are greater than 3 then the difference is considered significant for that electrode. This procedure is done for all 128 electrodes obtaining at the end the result shown in (E).

