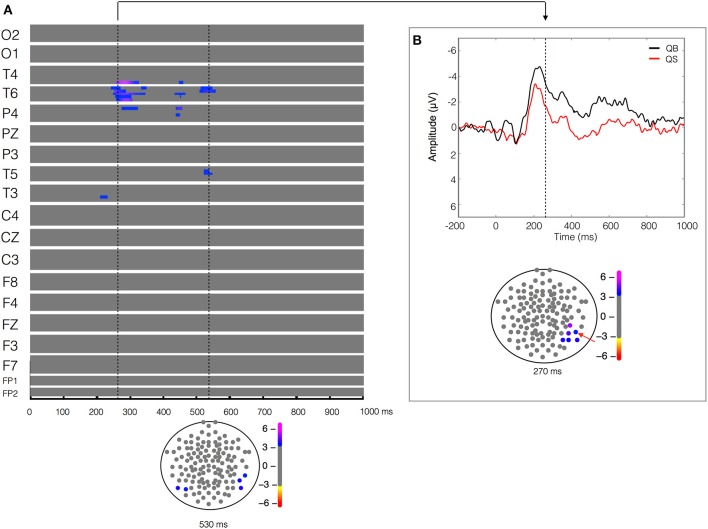
Figure 3.
Quiet biological (QB) vs. Quiet scrambled (QS). Plot of W-values for QB vs. QS contrast (upper panel in A), highlighting events at the 270 and 550 ms time points (vertical lines). Topological distribution of the differences is plotted in a 21-point temporal window centered at 270 ms time point in the bottom panel of (B). The corresponding event-related potentials obtained from temporal-parietal electrodes (inset red arrows) in the correspondent time point are presented in the upper panel.

