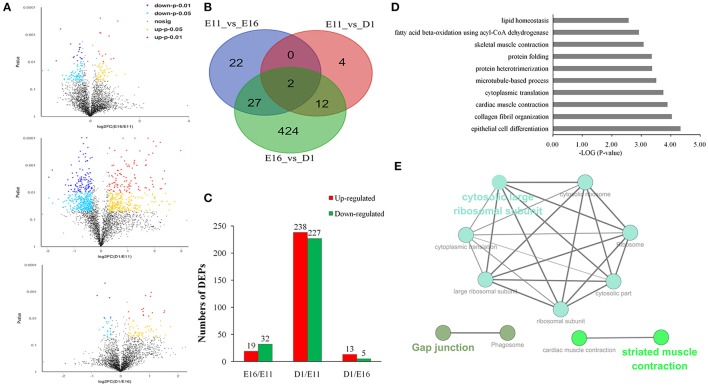
Figure 2.
Differentially expressed proteins in three different development stages of embryonic muscle. (A) Volcano plots of differentially expressed proteins in three comparisons: E11 vs. E16, E11 vs. D1, and E16 vs. D1. (B) Venn diagrams of differentially expressed proteins (n = 491; P < 0.05, fold change > 1.5 or < 0.66). (C) Number of differentially expressed proteins in three comparisons: E11 vs. E16, E11 vs. D1, and E16 vs. D1. (D) The top 10 GO enrichment terms for differentially expressed proteins. (E) The 57 proteins in the top 10 biological processes were analysis using ClueGO of Cytoscape software.

