
FIGURE 1.
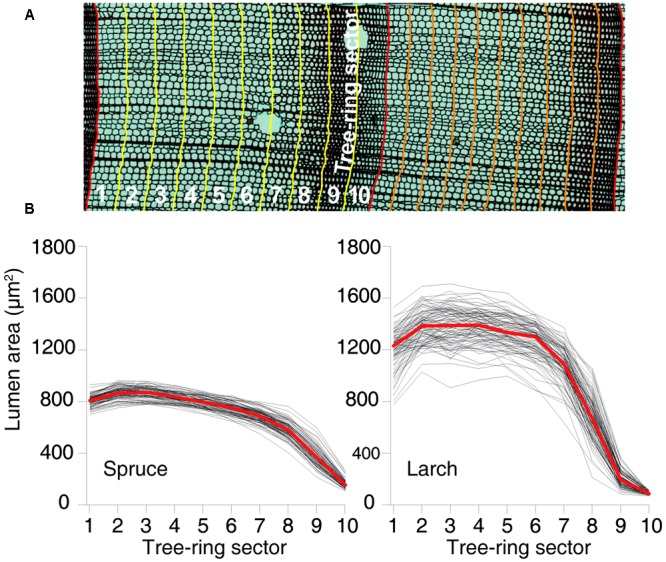
Tree-ring partitioning and profiles of cell-lumen area within the rings. (A) Graphical representation of tree-ring partitioning using 10 sectors. (B) Dimension of the mean lumen area by sector for each year between 1926 and 2012 for both species. Red lines represent the overall mean values.