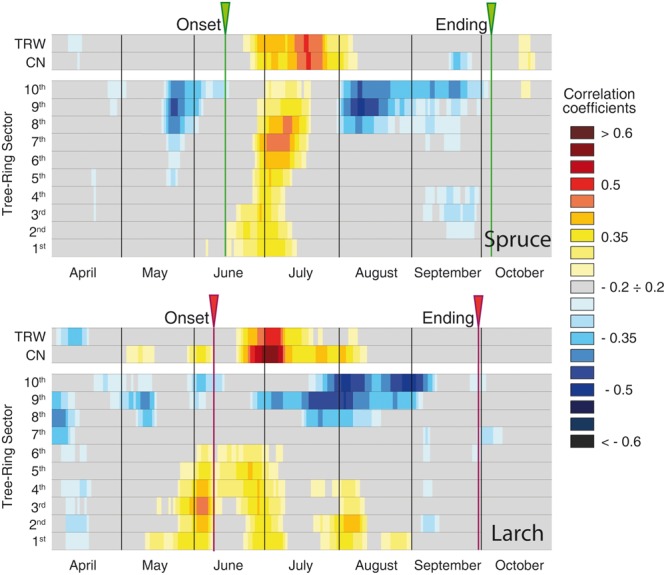
FIGURE 3.

Temperature-growth correlations (1926–2012), for the two species, computed between anatomical parameters (cell number and sectors chronologies) and ring-width chronologies, and mean temperature expressed as a 15-day moving window. Correlation coefficients are represented for each time window shifted at daily steps and are coded according to the color scale on the right. Gray cases are not significant, colored boxes are significant (p ≤ 0.05) with the standard approach (i.e., considering each test as independent). The arrows at the top of each plot correspond to the onset and ending dates detected by intensive monitoring with dendrometers or following xylem phenology (Rossi et al., 2006, 2008).
