
FIGURE 6.
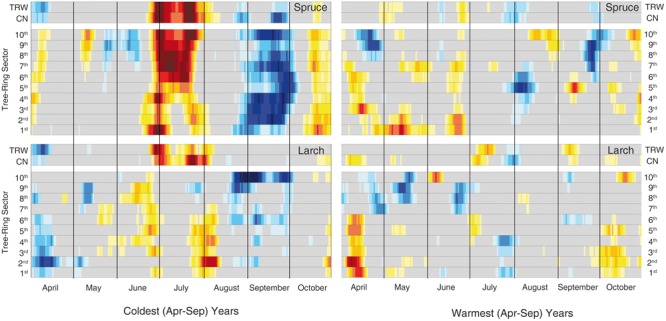
Temperature-growth correlations for the two species in the extreme years. Correlations have been computed between the same anatomical, tree-ring and temperature parameters as in Figure 3 but selecting just the 30 coldest and warmest years (based on mean April-September temperature) within the period 1926–2012. The representation and color coding are the same as Figure 3, however, in this case the threshold for significant (p < 0.05) correlations is set at |0.35| according to the fewer years considered than in the previous analysis.