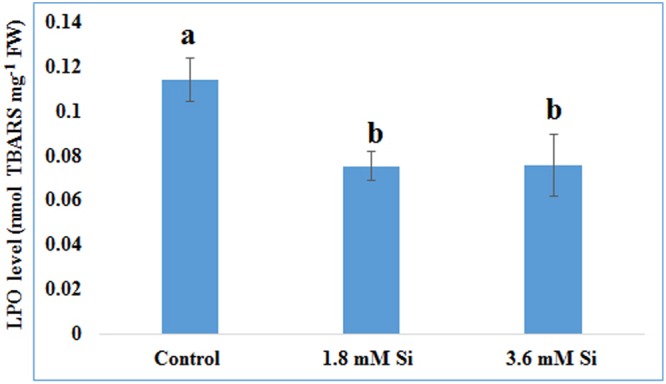
FIGURE 4.

Lipid peroxidation (LPO) of recovered hyperhydric shoots cultured on the MS medium with or without Si supplementation. Different letters indicate significant difference (ANOVA, Duncan, p ≤ 0.05). Data are the mean ± SD from three replicates. TBARS, thiobarbituric acid reactive substances; FW, fresh weight.
