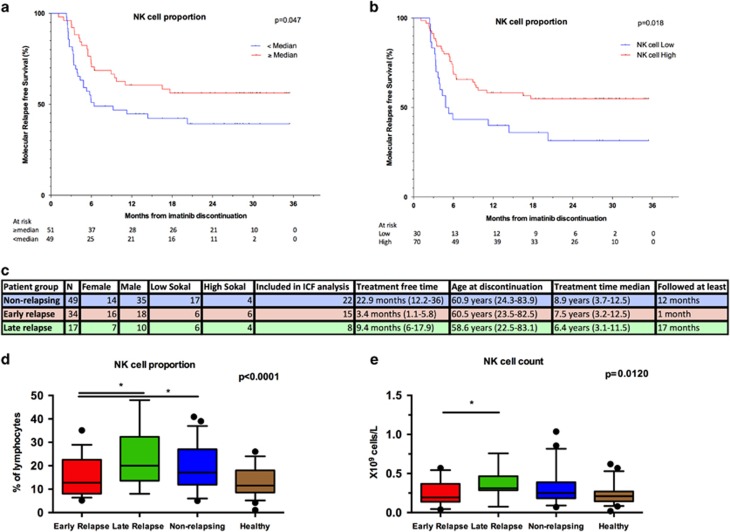
Figure 1.
The proportion and absolute count of NK cells at the time of imatinib discontinuation. (a) Molecular relapse-free survival of imatinib treated patients at baseline based on the median NK-cell proportion (in all patients median 16%, range 5–48%). Log-rank test was used to analyze the statistical significance between the two groups. Hazard ratio is reported in Table 1. (b) Patients were dichotomized to low- and high-NK-cell groups according to receiver-operating characteristics (ROC) curves and the Youden index to find more optimal cutoff for groups than the median value (AUROC 0.568, 95% CI: 0.4543–0.6818). On the basis of these analyses 11.3% was used as a cutoff. Hazard ratio is reported in the Supplementary Table 2. (c) Clinical characteristics of patients according to their TKI discontinuation success. Patients were divided in three groups: non-relapsing (able to maintain remission for at least 12 months, n=49), early relapsing (relapse before 6 months, n=34) and late relapsing patients (relapse after 6 months, n=17). ICF, immune cell function. (d) The relative number of NK cells at baseline in patient groups and healthy volunteers (n=48). Median early relapsing 12.8%, late relapsing 20%, non-relapsing 17.8% and healthy 11.5%. (e) Absolute NK-cell count at baseline in patient groups and healthy volunteers. Median early relapsing 0.19 × 10⁹ cells per l, late-relapsing 0.31 × 10⁹ cells per l, non-relapsing 0.25 × 10⁹ cells per l and healthy 0.21 × 10⁹ cells per l. Box-and-whisker plots present 5–95 percentiles. One-way ANOVA was used for comparison between multiple groups (exact P-value reported in the figure), and Bonferroni's post test was used to compare selected pairs (only early-relapse group was compared with other groups to avoid multiple comparisons). Statistically significant differences between the groups are noted with asterisk (*P<0.05).

