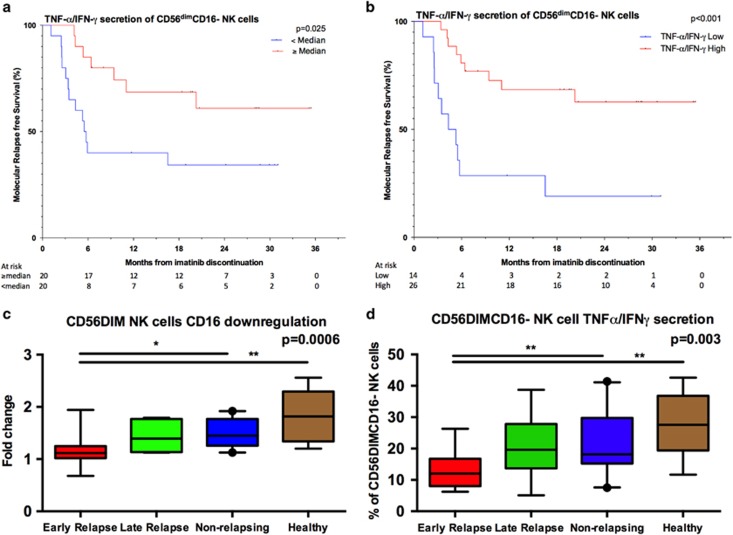
Figure 4.
NK-cell activation and cytokine secretion at the time of imatinib discontinuation. MNCs collected at the baseline before imatinib discontinuation were stimulated with K562 cells for 6 hours at +37C. After, the cells were collected and stained for surface and intracellular markers and analyzed with flow cytometry. (a) Molecular relapse-free survival of imatinib treated patients at baseline based on the median proportion of CD16- NK cells secreting TNF-α/IFN-γ. Log-rank test was used to analyze the statistical significance between the two groups. Hazard ratio is reported in Table 1. (b) Patients were dichotomized to low and high TNF-α/IFN-γ secretion groups according to ROC and the Youden index analyses (AUROC 0.7175; 95% CI: 0.5580–0.8770). 14.05% was used as a cutoff. Hazard ratio is reported in the Supplementary Table 2. (c) CD16 downregulation in CD56dim NK cells after K562 stimulation. (d) The proportion of CD16- NK cells secreting TNF-α/IFN-γ in patient groups at baseline after K562 stimulation. Early relapse n=14, late relapse n= 6, non-relapse n=19, and healthy n=8. (c, d) Box-and-whisker plots present 5–95 percentiles. One-way ANOVA was used for comparison between multiple groups (exact P-value reported in the figure), and Bonferroni's post test was used to compare selected pairs (only early relapse group was compared to other groups to avoid multiple comparisons). Statistically significant differences between the groups are marked with asterisk (*P<0.05, **P<0.01).

