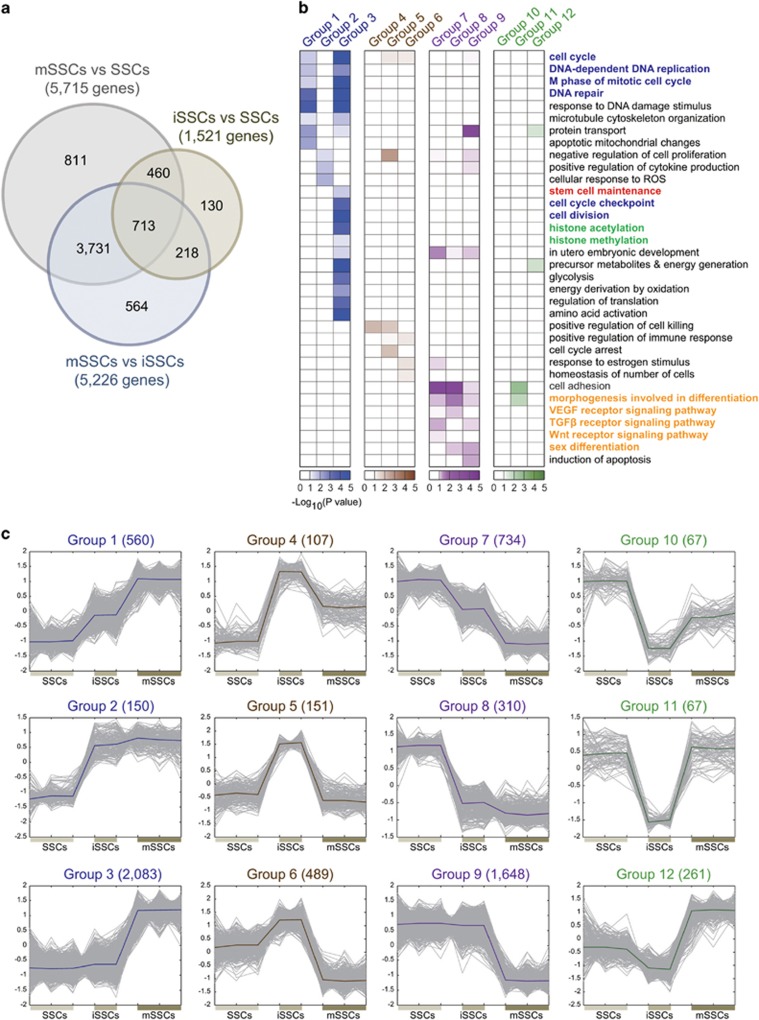
Figure 1.
DEGs during the reprogramming of SSCs to mSSCs. (a) DEGs identified from the three comparisons (mSSCs versus SSCs, mSSCs versus iSSCs and iSSCs versus SSCs). The Venn diagram shows the relationships among the DEGs in individual comparisons. The numbers in parentheses denote the numbers of DEGs identified in the individual comparisons. (b) Different expression patterns of DEGs in groups 1–12 during the reprogramming of SSCs to mSSCs. To clearly show the temporal differential expression patterns, the gene expression data in individual groups of DEGs were normalized to have zero mean values and unit standard deviations. Thick lines represent the median profiles of gene expression in groups 1–12. X-axis, replicates in SSCs, iSSCs and mSSCs; Y-axis, auto-scaled expression levels. (c) GOBPs associated with the genes in groups 1–12. The color in the heat maps represents −log10(P), in which P is the enrichment P-value obtained from the DAVID software for the corresponding GOBP. Different colors were used for four different groups of DEGs. In addition, the colored GOBP labels indicate the three pluripotency-related processes (stem cell maintenance (red), cell proliferation-related processes (blue), and epigenetic regulation (green)) and differentiation-related pathways and processes (orange).

