Figure 2.
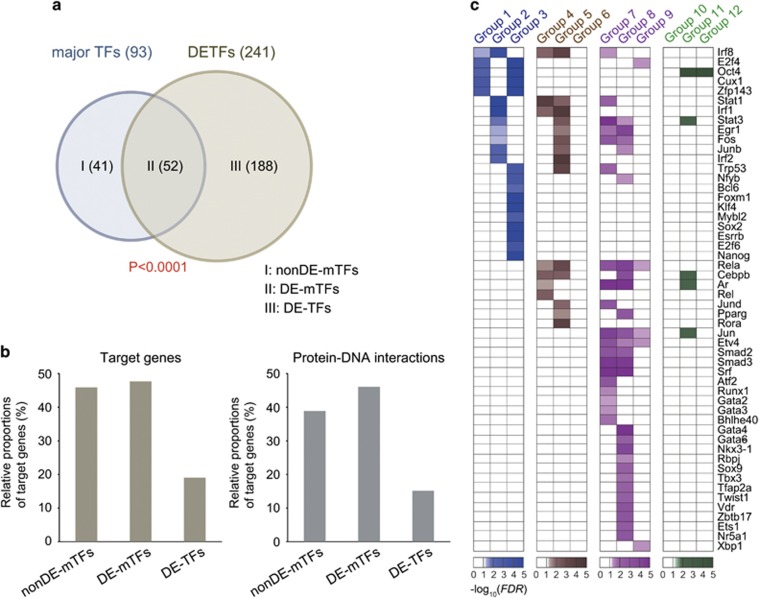
Major TFs predominantly regulating the DEGs during the reprogramming of SSCs to mSSCs. (a) Venn diagram showing the relationships among 93 major TFs and 241 DETFs. These TFs were categorized into three groups (I: 41 non-DE-mTFs; II: 52 DE-mTFs; and III: 188 DE-TFs). The overlap between the two sets of TFs was found to be significant (P<1 × 10⁻⁴ from hypergeometric test). (b) Relative proportions of DEGs regulated by the three groups of TFs (target genes, left) and the numbers of links between DEGs and the three groups of TFs (Protein–DNA interactions, right). (c) Heat maps showing the significance of the target genes in groups 1–12 that are regulated by the 52 DE-mTFs. The FDR was computed as the significance measure (‘Materials and Methods' section). The color represents –log10(FDR). Different colors were used for four different groups of DEGs.

