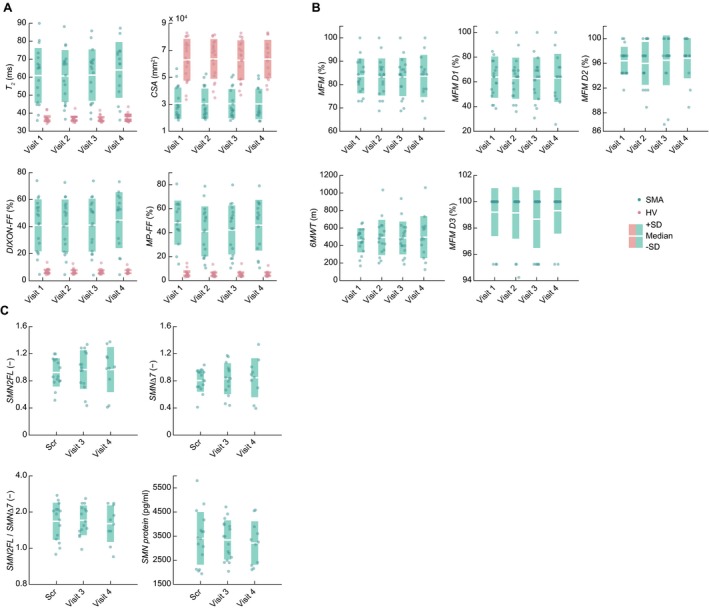
Figure 2.

Longitudinal assessment of the (A) qMRI, (B) motor function scales and (C) molecular characteristics. 6MWT: six‐minute walk test, CSA: muscle cross‐sectional area, FF: fat fraction, HV: healthy volunteers, MFM: motor function measure, MP‐FF: multi‐peak FF, qMRI: quantitative magnetic resonance imaging, Scr: screening visit, SD: standard deviation, SMA: spinal muscular atrophy patient, SMN2FL:SMN2 mRNA expression level, SMNΔ7: SMNΔ7 mRNA expression level.
