Figure 1.

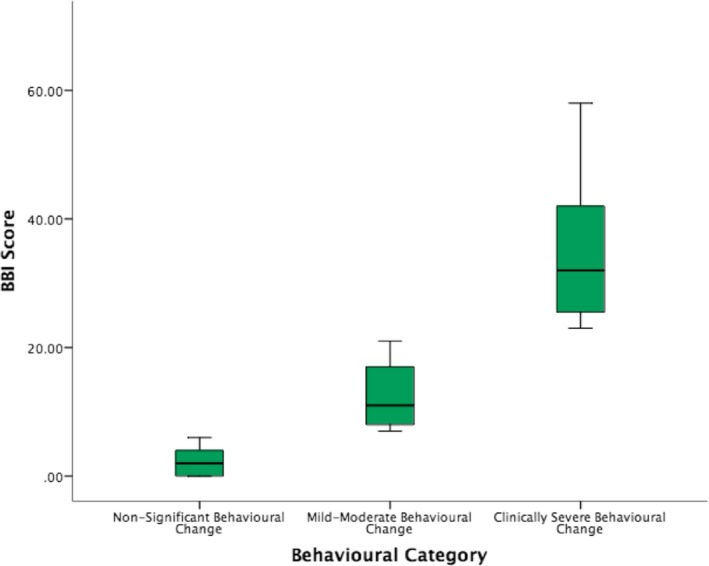
Box‐plots representing the behavioral data stratified by severity as nonsignificant behavioral change (n = 180), mild‐moderate behavioral change (n = 95), and clinically severe behavior change (n = 42).

Box‐plots representing the behavioral data stratified by severity as nonsignificant behavioral change (n = 180), mild‐moderate behavioral change (n = 95), and clinically severe behavior change (n = 42).