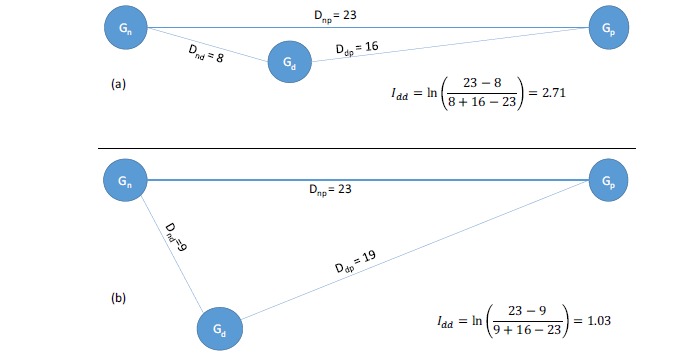
Fig. (3).

Numerical illustration of applying Idd in Eq. (1) in phenotypic screening to two sets of transcriptomic data (a) and (b). Gn, Gp and Gd refer to gene expression of normal cells, disease cells before drug application, and disease cells after drug application, respectively.
