Abstract
Background:
The pathogenesis of some types of preeclampsia is related to fatty acid oxidation disorders. Rapamycin can regulate fatty acid metabolism. This study aimed to investigate the effects of rapamycin on the clinical manifestations and blood lipid parameters in different preeclampsia-like mouse models.
Methods:
Two preeclampsia-like mouse models and a control group were established: L-NA (injected with Nω-nitro-L-arginine methyl ester), LPS (injected with lipopolysaccharide), and the control group with normal saline (NS). The mouse models were established at preimplantation (PI), early- and late-pregnancy (EP, LP) according to the time of pregnancy. The administration of rapamycin (RA; L-NA+RA, LPS+RA, and NS+RA) or vehicle as controls (C; L-NA+C, LPS+C, NS+C) were followed on the 2nd day after the mouse models’ establishment. Each subgroup consisted of eight pregnant mice. The mean arterial pressure (MAP), 24-h urinary protein, blood lipid, fetus, and placental weight were measured. The histopathological changes and lipid deposition of the liver and placenta were observed. Student's t-test was used for comparing two groups. Repeated measures analysis of variance was used for blood pressure analysis. Qualitative data were compared by Chi-square test.
Results:
The MAP and 24-h urinary protein in the PI, EP, and LP subgroups of the L-NA+C and LPS+C groups were significantly higher compared with the respective variables in the NS+C group (P < 0.05). The preeclampsia-like mouse models were established successfully. There was no significant difference in the MAP between the PI, EP, and LP subgroups of the L-NA+RA and L-NA+C groups and the LPS+RA and LPS+C groups. The 24-h urine protein levels in the PI and EP subgroups of the L-NA+RA group were significantly lower compared with the respective levels in the L-NA+C groups (1037 ± 63 vs. 2127 ± 593 μg; 976 ± 42 vs. 1238 ± 72 μg; both P < 0.05), also this effect appeared similar in the PI and EP subgroups of the LPS+RA and LPS+C groups (1022 ± 246 vs. 2141 ± 432 μg; 951 ± 41 vs. 1308 ± 30 μg; both P < 0.05). The levels of serum-free fatty acid (FFA) in the PI and EP subgroups of the L-NA+RA groups were significantly lower compared with the respective levels in the L-NA+C group (2.49 ± 0.44 vs. 3.30 ± 0.18 mEq/L; 2.23 ± 0.29 vs. 2.84 ± 0.14 mEq/L; both P < 0.05). The levels of triglycerides (TG) and total cholesterol in the PI subgroup of the L-NA+RA group were significantly lower compared with the respective levels in the L-NA+C (1.51 ± 0.16 vs. 2.41 ± 0.37 mmol/L; 2.11 ± 0.17 vs. 2.47 ± 0.26 mmol/L; both P < 0.05), whereas high-density lipoprotein serum concentration was significantly higher (1.22 ± 0.19 vs. 0.87 ± 0.15 mmol/L; P < 0.05) and low-density lipoprotein serum concentration did not exhibit a significant difference. There were no significant differences in the FFA of the PI, EP, and LP subgroups between the LPS+RA and the LPS+C groups. The levels of TG in the PI subgroup of the LPS+RA group were significantly lower compared with the respective levels in the LPS+C group (0.97 ± 0.05 vs. 1.22 ± 0.08 mmol/L; P < 0.05).
Conclusion:
Rapamycin can improve clinical manifestations and blood lipid profile in part of the preeclampsia-like mouse models.
Keywords: Mouse, Preeclampsia, Rapamycin
Introduction
Preeclampsia is a multifactor-related syndrome in pregnancy that is diagnosed by the combined presentation of high blood pressure and urinary protein. Preeclampsia is a common obstetric disease that affects 3–5% of pregnant women and is considered one of the main causes of maternal and perinatal morbidity and mortality.[1] The clinical risk factors of preeclampsia include primiparous, chronic hypertension, chronic kidney disease, history of thrombosis, multiple pregnancy, in vitro fertilization, family history of preeclampsia, type I or II diabetes, obesity, systemic lupus erythematosus, and a maternal age ≥40 years.[2] Chronic hypertension, diabetes, and obesity are associated with lipid metabolism disorders. It has been reported that the concentrations of free fatty acids (FFA), triglycerides (TG), and total cholesterol (TC) are significantly higher in preeclampsia.[3,4] Bartha et al. reported that fatty acid oxidation (FAO) in the placenta of preeclampsia patients is significantly lower compared with the control group, suggesting that placental FAO may be a potential risk factor for the pathogenesis of preeclampsia.[5] The studies conducted by our group have shown that long-chain FAO disorders are associated with the pathogenesis of some preeclampsia.[4,6,7]
Rapamycin is a macrolide antibiotic that is isolated from Streptomyces. At present, this drug has been widely used clinically. The specific binding protein of rapamycin is the mammalian target of rapamycin (mTOR).[8] Zhang et al.[9] have demonstrated that the expression of mTOR in the serum of patients with mild and severe preeclampsia was higher compared with the control group. The study reveals the correlation between high mTOR levels and preeclampsia. Rapamycin could regulate FAO by specifically inhibiting mTOR.[10] Since FAO disorders are involved in the development of some preeclampsia, rapamycin may affect the symptoms of preeclampsia by regulating FAO. Studies have confirmed that rapamycin could reduce urinary protein in animal models.[11,12] Rapamycin increased serum high-density lipoprotein (HDL) in patients of astrocytoma compared with the healthy control group[13] and decreased serum TG in mice with high-fat diet.[14] Collectively, the aforementioned studies suggested that rapamycin may be relevant with the relieving symptoms of preeclampsia. Furthermore, clinical studies confirm that rapamycin has no adverse effect on mothers and fetuses during pregnancy.[15,16]
In the present study, Nω-nitro-L-arginine methyl ester (L-NA) and lipopolysaccharide (LPS) as two different pathogenic factors have been used to establish preeclampsia-like mouse models. Three different time points of preimplantation (PI), early pregnancy (EP), and late pregnancy (LP) have been established. This study aimed to investigate the effects of rapamycin on the clinical manifestations and blood lipid profile in preeclampsia-like mouse models with different pathogenic factors and different gestations.
Methods
Animals
Animal experiments were approved by the Animal Care Committee and Medical Ethics Committee of Peking University, and all procedures were conducted in strict accordance with the guidelines of the Principles of Laboratory Animal Care, published by the National Institutes of Health. C57BL/6J mice were purchased from the Department of Laboratory Animal Science, at the Peking University Health Science Center. Female mice (8–10 weeks) and male mice (10–14 weeks) were housed under controlled conditions and fed with standard mouse chow with access to water ad libitum. The mice were mated and inspected daily for vaginal plugs. The day when vaginal plugs were observed was designated as day 1 of pregnancy (D1).
Establishment and intervention of mouse models
The C57BL/6J mice were divided into three groups: L-NA group, LPS group, and normal saline (NS) group. L-NA and LPS preeclampsia-like mouse models were established according to our previous study.[17] Rapamycin (0.25 mg/kg body weight/day, Sigma, USA) was suspended in 5% polyethylene glycol 400 (PEG400) (Sigma, USA) and 5% Tween-80 (Sigma), dissolved in water by constant stirring, and was administered to mice as a single oral gavage on the 2nd day after the establishment of the model,[18] which were rapamycin groups (RA, L-NA+RA, LPS+RA, NS+RA). The control group (C; L-NA+C, LPS+C, NS+C) of rapamycin included the vehicle suspension in the absence of rapamycin.[18] Each subgroup consisted of eight pregnant mice. The mice that were pregnant for 18 days were sacrificed after cesarean section. The mean arterial pressure (MAP) of the mice was measured every 2 days using CODA noninvasive tail cuff system (Kent Scientific Corporation, USA) on the 2nd day after conception and the mice were placed in a standard metabolic cage 17 days after conception. The 24-h urinary protein concentration was measured with the urinary protein detection kit (Randox, UK).
Sample collection and tests
The mice were anesthetized with 10% chloral hydrate (3 ml/kg, Sigma) on the 18th day of pregnancy. The blood samples that were collected from the retro-orbital plexus were centrifuged. The serum FFA concentration was measured by a blood lipid chemical analysis kit (Wako Chemicals, Japan), and the TG, TC, HDL, and low-density lipoprotein (LDL) levels were measured using an automatic biochemical analyzer (Olympus, Japan). The fetuses and placental tissues were collected and weighed. The total number of fetus, the number of live fetuses, and the number of the absorbed fetuses were recorded. The liver and placental tissues were collected and fixed with formalin for 48 h. Following embedding and slicing (5 μm), conventional hematoxylin and eosin (H and E) staining was carried out. The liver and placental tissues of mice were frozen and cut into 10-μm sections and finally stained with Oil Red O (GenMed Scientifics, USA). The sections were photographed by an optical microscope (Nikon, Japan).
Statistical analysis
SPSS software version 22.0 (SPSS Inc., USA) was used for data analysis. Data were expressed as mean ± standard deviation. Student's t-test was used for comparing 24-h urinary protein, blood lipids, and area of Oil Red O staining between two groups. Repeated measures analysis of variance was used for MAP analysis. Qualitative data were compared by Chi-square test. P < 0.05 was considered statistically significant.
Results
Mean arterial pressure and 24-h urinary protein
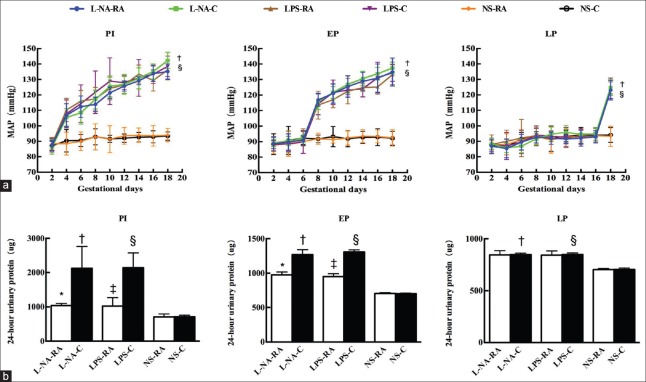
The MAP in the PI, EP, and LP subgroups of the L-NA+C group was significantly higher compared with the respective levels of the NS+C group (all P < 0.05), and also the MAP in the PI, EP, and LP subgroups of the LPS+C group was significantly higher compared with the respective levels of the NS+C group (all P < 0.05). The 24-h urinary protein levels in the PI, EP, and LP subgroups of the L-NA+C group were significantly higher compared with the respective levels of the NS+C group (t = 6.31, 21.86, and 19.35 respectively; all P < 0.05), and also the 24-h urinary protein levels in the PI, EP, and LP subgroups of the LPS+C group were significantly higher compared with the respective levels of the NS+C group (t = 9.33, 52.49, and 19.10 respectively; all P < 0.05). The preeclampsia-like mouse models were established successfully. The 24-h urinary protein levels in the PI and EP subgroups of the L-NA+RA group were significantly lower compared with the respective levels of the L-NA+C group (1037 ± 63 vs. 2127 ± 593 μg; 976 ± 42 vs. 1238 ± 72 μg; t = 4.84, 9.94; both P < 0.05), and also the 24-h urinary protein levels in the PI and EP subgroups of the LPS+RA group were significantly lower compared with the respective levels of the LPS+C group (1022 ± 246 vs. 2141 ± 432 μg; 951 ± 41 vs. 1308 ± 30 μg; t = 6.37, 19.26; both P < 0.05). Rapamycin could reduce 24-h urinary protein levels in the PI and EP subgroups of L-NA and LPS, but had no effect on the MAP of L-NA and LPS preeclampsia-like mouse models [Figure 1].
Figure 1.
Mean arterial blood pressure and 24-h urinary protein levels in all groups. (a) Mean arterial blood pressure during the pregnancy period and (b) 24-h urinary protein levels. *P < 0.05, L-NA+RA vs. L-NA+C group; †P < 0.05 L-NA+C vs. NS+C group; ‡P < 0.05, LPS+RA vs. LPS+C group; §P < 0.05, LPS+C vs. NS+C group. PI: Preimplantation; EP: Early pregnancy; LP: Late pregnancy; L-NA+RA: L-arginine methyl ester-rapamycin; L-NA+C: L-arginine methyl ester-control; LPS+RA: Lipopolysaccharide-rapamycin; LPS+C: Lipopolysaccharide-control; NS: Normal saline. n = 8 per group.
Blood lipids
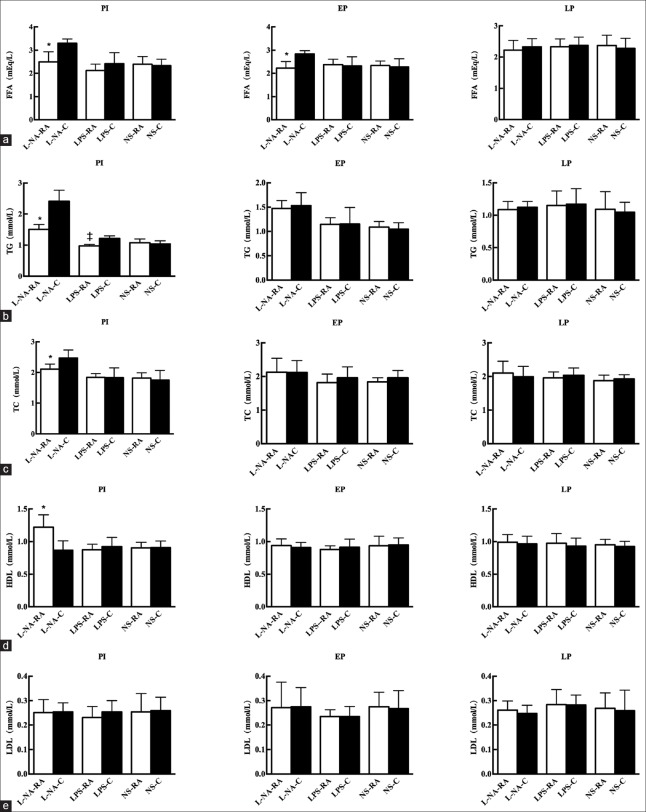
The FFA levels of the PI and EP subgroups in the L-NA+RA group were lower compared with the respective levels in the L-NA+C group (2.49 ± 0.44 vs. 3.30 ± 0.18 mEq/L; 2.23 ± 0.29 vs. 2.84 ± 0.14 mEq/L; t = 4.78, 5.41; both P < 0.05). The levels of TG and TC in the PI subgroup of the L-NA+RA were significantly lower compared with the respective levels of the L-NA+C group (1.51 ± 0.16 vs. 2.41 ± 0.37 mmol/L; 2.11 ± 0.17 vs. 2.47 ± 0.26 mmol/L; t = 6.54, 3.28; both P < 0.05), whereas HDL concentration was significantly higher (1.22 ± 0.19 vs. 0.87 ± 0.15 mmol/L; t = −4.25; P < 0.05) and LDL concentration was not significantly different. The levels of TG in the PI subgroup of the LPS+RA group were significantly lower compared with the respective levels of the LPS+C group (0.97 ± 0.05 vs. 1.22 ± 0.08 mmol/L; t = 7.08; P < 0.05) [Figure 2].
Figure 2.
Free fatty acid (a), triglyceride (b), cholesterol (c), high-density lipoprotein (d), and low-density lipoprtein (e) levels in all groups. *P < 0.05, L-NA+RA group versus L-NA+C group. ‡P < 0.05, LPS+RA versus LPS+C group. L-NA+RA: L-arginine methyl ester-rapamycin; L-NA+C: L-arginine methyl ester-control.
Placenta and liver histological changes and fat staining
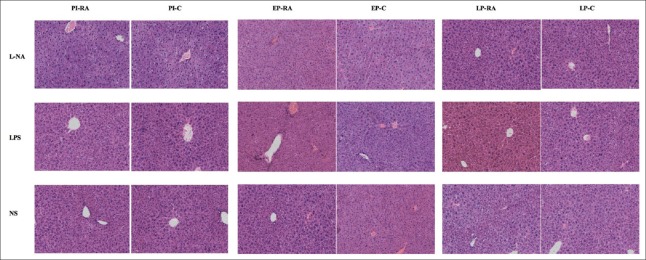
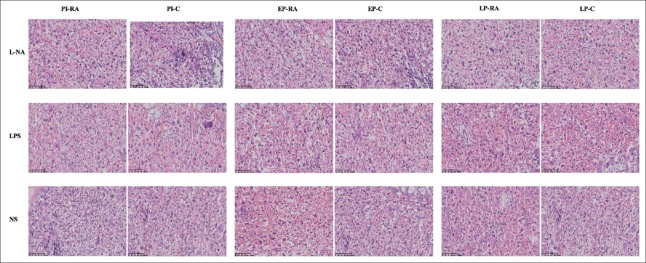
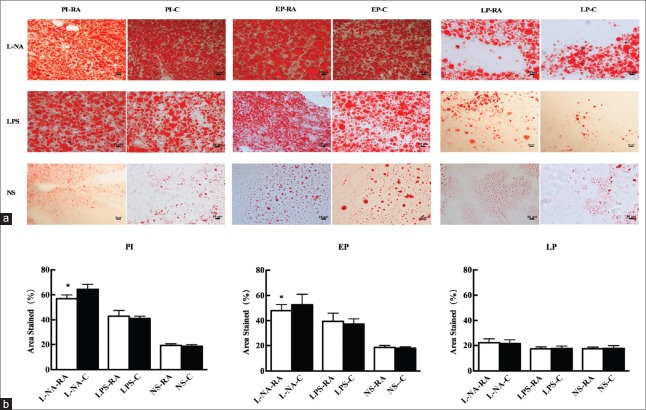
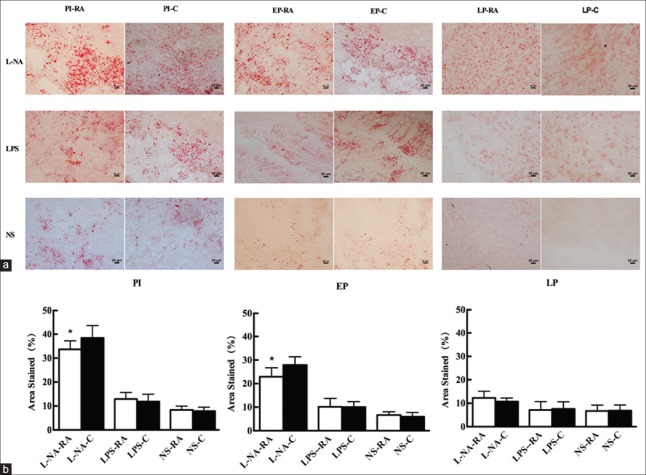
The histological changes of the liver and placental tissue were observed in different H and E staining sections. In the PI and EP subgroups of the L-NA group, hepatocyte ballooning degeneration and loose tissue structure could be observed. The hepatocyte ballooning degeneration effect was alleviated in the PI and EP subgroups of the L-NA+RA group compared with the L-NA+C group. In the LPS and NS groups, no apparent liver tissue damage with regard to the structure and cellular morphology was observed [Figure 3]. The placental syncytial cell knot hyperplasia was observed in the PI and EP subgroups of the L-NA and LPS groups. The placental syncytial cell knot hyperplasia was induced to a lesser extent in the PI and EP subgroups of the L-NA+RA group compared with the L-NA+C group, and also the effect was similar between the LPS+RA and LPS+C groups [Figure 4]. The percentage of Oil Red O staining in the liver tissue in the PI and EP subgroups of the L-NA+RA group was lower compared with that observed in the L-NA+C group (t = 4.28, 3.54; both P < 0.05) [Figure 5]. The percentage of Oil Red O staining in the placental tissue in the PI and EP subgroups of the L-NA+RA group was lower compared with that observed in the L-NA+C group (t = 2.10, 2.72; both P < 0.05) [Figure 6].
Figure 3.
Morphological changes in the maternal liver in all groups. In the PI and EP subgroups of the L-NA group, hepatocyte balloon degeneration and loose tissue structure were observed. The LPS and saline groups exhibited no apparent liver tissue damage with regard to the structural and cellular morphology (H and E, ×200). LPS: Lipopolysaccharide; PI: Preimplantation; EP: Early pregnancy; L-NA: L-arginine methyl ester; LP: Late pregnancy; NS: Normal saline.
Figure 4.
Morphological changes in the placental tissue in all groups. Placental trophoblastic cell edema, necrosis, and placental syncytial cell knot hyperplasia were observed in the PI and EP subgroups of the L-NA and LPS groups (H and E, ×200). LPS: Lipopolysaccharide; PI: Preimplantation; EP: Early pregnancy; L-NA: L-arginine methyl ester; LP: Late pregnancy; NS: Normal saline.
Figure 5.
Lipid deposition in maternal liver tissues with Oil Red O staining in all groups (a). (Liver histology, original magnification, ×200 and scale bars 20 μm) and percentage of area stained in all groups (b). *P < 0.05 L-NA+RA group versus L-NA+C group. L-NA+RA: L-arginine methyl ester-rapamycin; L-NA+C: L-arginine methyl ester-control.
Figure 6.
Lipid deposition in placental with Oil Red O staining in all groups (a). (Placental histology, original magnification, ×200 and scale bars 20 μm) and percentage of area stained in all groups (b). *P < 0.05 L-NA+RA group versus L-NA+C group. L-NA+RA: L-arginine methyl ester-rapamycin; L-NA+C: L-arginine methyl ester-control.
Pregnancy outcomes
The fetal absorption rate was significantly lower, and the live birth rate was significantly higher in the PI subgroup of the L-NA+RA group compared with that noted in the L-NA+C group (χ2 = 268.45, P < 0.05) [Table 1]. The mean fetus and placental weight of the PI subgroup in the LPS+RA group was significantly lower compared with that noted in the LPS+C group (t = 2.94, 3.27; both P < 0.05). There was no significant difference in the parameters such as live birth rate, fetal absorption rate, and fetus and placental weight between the remaining rapamycin groups and the respective control groups [Table 2].
Table 1.
The number and rate of live fetuses and absorbed fetuses in all groups (n (%))
| Groups | Live fetuses | Absorbed fetuses | ||||
|---|---|---|---|---|---|---|
| PI | EP | LP | PI | EP | LP | |
| L-NA+RA | 54 (89.2)* | 51 (87.9) | 58 (95.1) | 6 (10.8)* | 7 (12.1) | 3 (4.9) |
| L-NA+C | 41 (78.1) | 54 (88.5) | 64 (94.1) | 11 (21.9) | 7 (11.4) | 4 (5.9) |
| LPS+RA | 55 (83.3) | 56 (88.9) | 55 (94.8) | 9 (16.7) | 7 (11.1) | 3 (5.2) |
| LPS+C | 48 (82.0) | 55 (88.7) | 66 (94.3) | 10 (18.0) | 7 (11.3) | 4 (5.7) |
| NS+RA | 62 (94.6) | 67 (94.3) | 54 (94.7) | 4 (5.4) | 4 (5.6) | 3 (5.2) |
| NS+C | 63 (94.7) | 66 (94.3) | 61 (95.3) | 4 (5.3) | 4 (5.7) | 3 (4.7) |
Data were shown as n (%). *P<0.05, L-NA+RA versus L-NA+C. SD: Standard deviation; LPS+RA: Lipopolysaccharide-rapamycin; LPS+C: Lipopolysaccharide-control; L-NA+RA: L-arginine methyl ester-rapamycin; L-NA+C: L-arginine methyl ester-control; NS+RA: Normal saline-rapamycin; NS+C: Normal saline-control; PI: Preimplantation; EP: Early pregnancy; LP: Late pregnancy.
Table 2.
Fetal weight and placental weight in all groups
| Groups | Fetal weight (g) | Placental weight (mg) | ||||
|---|---|---|---|---|---|---|
| PI | EP | LP | PI | EP | LP | |
| L-NA+RA | 0.77 ± 0.07 | 0.86 ± 0.11 | 0.95 ± 0.12 | 79.5 ± 6.1 | 85.1 ± 3.6 | 95.4 ± 9.4 |
| L-NA+C | 0.76 ± 0.06 | 0.87 ± 0.05 | 0.95 ± 0.06 | 78.8 ± 6.6 | 85.1 ± 12.8 | 95.5 ± 7.7 |
| LPS+RA | 0.70 ± 0.05* | 0.86 ± 0.04 | 0.95 ± 0.07 | 69.6 ± 3.3* | 85.3 ± 5.7 | 95.1 ± 12.6 |
| LPS+C | 0.77 ± 0.05 | 0.87 ± 0.04 | 0.95 ± 0.07 | 78.6 ± 7.1 | 85.3 ± 7.8 | 95.6 ± 11.7 |
| NS+RA | 0.96 ± 0.08 | 0.95 ± 0.07 | 0.96 ± 0.07 | 94.3 ± 6.6 | 95.3 ± 7.7 | 95.2 ± 6.5 |
| NS+C | 0.95 ± 0.08 | 0.96 ± 0.05 | 0.96 ± 0.08 | 94.6 ± 7.2 | 95.2 ± 16.5 | 95.9 ± 5.5 |
Data were shown as mean±SD. *P<0.05, LPS+RA versus LPS+C. SD: Standard deviation; LPS+RA: Lipopolysaccharide-rapamycin; LPS+C: Lipopolysaccharide-control; L-NA+RA: L-arginine methyl ester-rapamycin; L-NA+C: L-arginine methyl ester-control; NS+RA: Normal saline-rapamycin; NS+C: Normal saline-control; PI: Preimplantation; EP: Early pregnancy; LP: Late pregnancy.
Discussion
The present study demonstrated that rapamycin improves part of the clinical symptoms of specific preeclampsia-like mouse models, which has been proved to be determined by the decreased 24-h urinary protein levels, decreased blood lipid concentrations (FFA, TG, and TC), increase in the concentration of HDL, and reduced liver and placental lipid deposition. In the present study, the potential effect of rapamycin on preeclampsia has been investigated. In different preeclampsia-like mouse models, the effect of rapamycin is different.
Accumulating studies have suggested that FAO is an important contributor in the development of placenta and that this process is associated with the pathogenesis of preeclampsia. Rakheja et al.[19] confirmed that placenta has fatty acid oxidase activity and could potentially use fatty acids as energy sources. The FAO in the placenta of the preeclampsia group was significantly reduced compared with that of the control group. Bartha et al.[5] suggested that placental FAO played a role in the pathogenesis of preeclampsia. Previous studies from our research group have shown that long-chain FAO disorders are associated with the pathogenesis of preeclampsia. FFA and TG levels in the severe preeclampsia group were significantly higher compared with that of the control group. The experimental results showed that patients of severe preeclampsia presented with lipid metabolism disorders, whereas the increased concentration of FFA in severe preeclampsia may affect the lipid metabolism disorders.[20] Rapamycin is a specific inhibitor of mTOR. mTOR plays an important role in the FAO in various tissues and cells. In 2007, Nicholas reported that rapamycin enhanced the oxidation of saturated long-chain fatty acids in rat hepatocytes, suggesting that rapamycin can contribute to the metabolism of fatty acids in hepatocytes.[21] Deepa et al.[22] reported that the effects of rapamycin on mitochondrial FAO could be reversed in murine models that were homozygous or heterozygous for point mutations of the leptin receptor. Deepa et al. indicated that the regulation of FAO and metabolism by rapamycin were different in different animal models. The present study used rapamycin to examine the clinical manifestations and blood lipid profile of different preeclampsia-like mouse models.
In the present study, the MAP and 24-h urinary protein in the PI, EP, and LP subgroups of the L-NA+C and LPS+C groups were significantly higher compared with that of the respective variables in the NS+C group. The results indicated that preeclampsia-like mouse models were successfully established. It was found that rapamycin had no significant effect on the blood pressure of preeclampsia-like mouse models, but it could significantly reduce 24-h urinary protein in PI and EP subgroups of L-NA and LPS groups. The clinical symptoms of the preeclampsia-like mice exhibited a moderate improvement following rapamycin treatment. In this study, rapamycin indeed had no effect on blood pressure, maybe it cannot affect the vessel relaxation or other factors which regulate blood pressure. Studies by Stillman and Karumanchi suggest that the formation of proteinuria in preeclampsia and glomerular immune complex deposition are closely related.[23] Many scholars have confirmed that rapamycin can reduce deposition of renal immune complexes, which decreases proteinuria in a variety of nephritis.[11,24] In this study, we postulated that rapamycin might decrease proteinuria by reducing the deposition of immune complexes in preeclampsia. Tian et al.[11] demonstrated that administration of a low dose of rapamycin to IgA rats effectively reduced urinary protein, inhibited IgA precipitation, and protected renal function. Furthermore, Stridh et al.[12] reported that, in rapamycin-treated diabetic mice, urinary protein was reduced by 32%. The aforementioned studies and the results presented in our study demonstrated that rapamycin in some diseases reduces urinary protein and protects kidney function.
In the present study, it has been shown that rapamycin could reduce FFA, TG, and TC levels in some preeclampsia-like mice. In addition, rapamycin improves the histopathological parameters of the liver and placental tissues and alleviates lipid deposition in part of the preeclampsia-like mouse models. The association of the types and gestation period in preeclampsia and FAO has been shown by our previous study in mice.[4] In the present study, it was speculated that the regulation of lipid metabolism by rapamycin in preeclampsia-like mice was associated with the changes in the blood lipid profile. One of the reported side effects of rapamycin is hyperlipidemia. The incidence of hyperlipidemia has been estimated to be 40% in patients treated with rapamycin, following organ transplantation in the 2nd or 3rd month after surgery.[25] However, multiple studies have reported that rapamycin can lower the blood lipid levels. In 2003, Basso et al.[26] suggested that rapamycin-treated mice exhibited a decreased cholesterol content (36%) of the aortic arch compared with the control group. In a study, rapamycin was injected in mice for 42 consecutive days and the levels of TG were decreased.[14] Tabatabai et al.[27] revealed that rapamycin lowered the serum TG levels in male diabetic mice. In addition, Deepa et al.[22] confirmed that the circulating unesterified FFA of diabetic mice was decreased, following rapamycin treatment for 6 months compared with the control group. Das et al.[28] showed that rapamycin decreased the TG levels in mice with type 2 diabetes mellitus. The above researches indicated that the effect of rapamycin on blood lipids differed according to the underlying pathology. The results presented in the current study showed that rapamycin had a blood lipid-lowering effect in preeclampsia-like mice. The extent of the blood lipid effect depends on the regulation of FAO in different preeclampsia-like mouse models.
The results of the present study indicated that rapamycin exhibited no adverse effects on the pregnancy outcome of early and late gestation in preeclampsia-like mice, although it was associated with different pregnancy outcomes in the PI subgroups of the L-NA and LPS groups. The pregnancy outcomes (reduction in fetal absorption rate and increase in the live birth rate) in the PI subgroup of the L-NA group were improved, despite the detrimental effect of rapamycin on the pregnancy outcomes in the PI subgroup of the LPS group (mean fetal and placental weight reduction). Rapamycin has been shown to reduce energy intake in trophoblast cells and it was suggested that it may affect fetal growth, causing fetal growth restriction.[29] Recently, it was reported that rapamycin prevented premature labor and reduced fetal mortality in a premature labor mouse model.[18] Furthermore, rapamycin has been used to treat multiple sclerosis in a model of pregnant mice and it can reduce the lethality of gene mutations in the mice fetuses.[30] In addition to the aforementioned observations, a large body of evidence derived from clinical studies has confirmed that the use of rapamycin has no adverse effects on the mother and fetus. Jankowska et al.[15] reported a case study of a 21-year-old pregnant woman who gave birth in the absence of any complications, following liver transplantation and rapamycin treatment in the first 6 weeks of pregnancy whereas Faehling reported a case study of a patient with long-term use of rapamycin (78 months) and successful pregnancy. Administration of low dose of rapamycin indicated no adverse effects on the mother and fetus during pregnancy.[16] In the present study, it was hypothesized that rapamycin intervention is safe during pregnancy, based on the interaction and the effects of the latter on the pregnancy outcomes in preeclampsia-like mice. Rapamycin has been widely used clinically during the last decades. Franz et al.[31] demonstrated that rapamycin improved the clinical symptoms of five tuberous sclerosis patients. In addition, rapamycin has been used to treat refractory angina due to its reduced atherosclerosis and left ventricular oxygen consumption.[32]
In conclusion, the present study confirms that rapamycin can improve clinical manifestations in part of the preeclampsia-like mouse models. Rapamycin has the potential to treat proteinuria and dyslipidemia in patients with preeclampsia. Whether rapamycin can be used for treating preeclampsia will be further explored. Moreover, in the present study, we found that rapamycin affects the clinical symptoms and blood lipid profiles of preeclampsia-like mice, suggesting a putative role in the regulation of FAO. In different preeclampsia-like mouse models, the regulation of FAO by rapamycin may be different. This study provided an experimental basis for individualized treatment of different pathogenic factors in clinical practice. Further clinical validation is needed beyond the animal test.
Financial support and sponsorship
This work was supported by grants from the National Natural Science Foundation of China (No. 81370723) and Beijing Municipal Natural Science Foundation (No. 7132215).
Conflicts of interest
There are no conflicts of interest.
Footnotes
Edited by: Yuan-Yuan Ji
References
- 1.Ananth CV, Keyes KM, Wapner RJ. Pre-eclampsia rates in the United States, 1980-2010: Age-period-cohort analysis. BMJ. 2013;347:f6564. doi: 10.1136/bmj.f6564. doi: 10.1136/bmj. [DOI] [PMC free article] [PubMed] [Google Scholar]
- 2.American College of Obstetricians and Gynecologists. Hypertension in Pregnancy. Washington, DC: American College of Obstetricians and Gynecologists; 2013. [Google Scholar]
- 3.Han YW, Yang Z, Ding XY, Yu H. Differences in liver injury and trophoblastic mitochondrial damage in different preeclampsia-like mouse models. Chin Med J. 2015;128:1627–35. doi: 10.4103/0366-6999.158322. doi: 10.4103/0366-6999.158322. [DOI] [PMC free article] [PubMed] [Google Scholar]
- 4.Ding X, Yang Z, Han Y, Yu H. Fatty acid oxidation changes and the correlation with oxidative stress in different preeclampsia-like mouse models. PLoS One. 2014;9:e109554. doi: 10.1371/journal.pone.0109554. doi: 10.1371/journal.pone.0109554. [DOI] [PMC free article] [PubMed] [Google Scholar]
- 5.Bartha JL, Visiedo F, Fernández-Deudero A, Bugatto F, Perdomo G. Decreased mitochondrial fatty acid oxidation in placentas from women with preeclampsia. Placenta. 2012;33:132–4. doi: 10.1016/j.placenta.2011.11.027. doi: 10.1016/j.placenta.2011.11.027. [DOI] [PubMed] [Google Scholar]
- 6.Ma RQ, Sun MN, Yang Z. Inhibition of nitric oxide synthase lowers fatty acid oxidation in preeclampsia-like mice at early gestational stage. Chin Med J. 2011;124:3141–7. [PubMed] [Google Scholar]
- 7.Ding X, Yang Z, Han Y, Yu H. Long-chain fatty acid oxidation changes in a β2 glycoprotein I-induced preeclampsia-like mouse model. Placenta. 2014;35:392–7. doi: 10.1016/j.placenta.2014.03.013. doi: 10.1016/j.placenta.2014.03.013. [DOI] [PubMed] [Google Scholar]
- 8.Brown EJ, Albers MW, Shin TB, Ichikawa K, Keith CT, Lane WS, et al. A mammalian protein targeted by G1-arresting rapamycin-receptor complex. Nature. 1994;369:756–8. doi: 10.1038/369756a0. doi: 10.1038/369756a0. [DOI] [PubMed] [Google Scholar]
- 9.Zhang Y, Zhang B, Wei ZL, Lv WJ, Yang YY, Chen Y. Diagnostic significance of phosphoinositide 3-kinase and mammalian target of rapamycin complex 1 in preeclampsia. Reprod Sci. 2017;24:268–75. doi: 10.1177/1933719116653675. doi: 10.1177/1933719116653675. [DOI] [PubMed] [Google Scholar]
- 10.Peng T, Golub TR, Sabatini DM. The immunosuppressant rapamycin mimics a starvation-like signal distinct from amino acid and glucose deprivation. Mol Cell Biol. 2002;22:5575–84. doi: 10.1128/MCB.22.15.5575-5584.2002. doi: 10.1128/MCB.22.15.5575-5584.2002. [DOI] [PMC free article] [PubMed] [Google Scholar]
- 11.Tian J, Wang Y, Guo H, Li R. The Akt/mTOR/p70S6K pathway is activated in IgA nephropathy and rapamycin may represent a viable treatment option. Exp Mol Pathol. 2015;99:435–40. doi: 10.1016/j.yexmp.2015.08.004. doi: 10.1016/j.yexmp.2015.08.004. [DOI] [PubMed] [Google Scholar]
- 12.Stridh S, Palm F, Takahashi T, Ikegami-Kawai M, Hansell P. Inhibition of mTOR activity in diabetes mellitus reduces proteinuria but not renal accumulation of hyaluronan. Ups J Med Sci. 2015;120:233–40. doi: 10.3109/03009734.2015.1062442. doi: 10.2337/db12-1504. [DOI] [PMC free article] [PubMed] [Google Scholar]
- 13.Trelinska J, Dachowska I, Kotulska K, Józwiak S, Fendler W, Mlynarski W. Everolimus treatment among patients with tuberous sclerosis affects serum lipid profile. Pharmacol Rep. 2016;68:1002–7. doi: 10.1016/j.pharep.2016.05.011. doi: 10.1016/j.pharep.2016.05.011. [DOI] [PubMed] [Google Scholar]
- 14.Chang GR, Wu YY, Chiu YS, Chen WY, Liao JW, Hsu HM, et al. Long-term administration of rapamycin reduces adiposity, but impairs glucose tolerance in high-fat diet-fed KK/HlJ mice. Basic Clin Pharmacol Toxicol. 2009;105:188–98. doi: 10.1111/j.1742-7843.2009.00427.x. doi: 10.1111/j.1742-7843.2009.00427.x. [DOI] [PubMed] [Google Scholar]
- 15.Jankowska I, Oldakowska-Jedynak U, Jabiry-Zieniewicz Z, Cyganek A, Pawlowska J, Teisseyre M, et al. Absence of teratogenicity of sirolimus used during early pregnancy in a liver transplant recipient. Transplant Proc. 2004;36:3232–3. doi: 10.1016/j.transproceed.2004.11.102. doi: 10.1016/j.transproceed.2004.11.102. [DOI] [PubMed] [Google Scholar]
- 16.Faehling M, Wienhausen-Wilke V, Fallscheer S, Trinajstic-Schulz B, Weber J, Leschke M. Long-term stable lung function and second uncomplicated pregnancy on sirolimus in lymphangioleiomyomatosis (LAM) Sarcoidosis Vasc Diffuse Lung Dis. 2015;32:259–64. [PubMed] [Google Scholar]
- 17.Ding X, Yang Z, Han Y, Yu H. Correlation of long-chain fatty acid oxidation with oxidative stress and inflammation in pre-eclampsia-like mouse models. Placenta. 2015;36:1442–9. doi: 10.1016/j.placenta.2015.10.014. doi: 10.1016/j.placenta.2015.10.014. [DOI] [PubMed] [Google Scholar]
- 18.Hirota Y, Cha J, Yoshie M, Daikoku T, Dey SK. Heightened uterine mammalian target of rapamycin complex 1 (mTORC1) signaling provokes preterm birth in mice. Proc Natl Acad Sci U S A. 2011;108:18073–8. doi: 10.1073/pnas.1108180108. doi: 10.1073/pnas.1108180108. [DOI] [PMC free article] [PubMed] [Google Scholar]
- 19.Rakheja D, Bennett MJ, Foster BM, Domiati-Saad R, Rogers BB. Evidence for fatty acid oxidation in human placenta, and the relationship of fatty acid oxidation enzyme activities with gestational age. Placenta. 2002;23:447–50. doi: 10.1053/plac.2002.0808. doi: 10.1053/plac.2002.0808. [DOI] [PubMed] [Google Scholar]
- 20.Wang JL, Yang Z, Wang R. Preeclampsia patients with lipid metabolism regulation explore (in Chinese) Prog Obstet Gynecol. 2006;6:438–41. doi: 10.3969/j.issn.1004-7379.2006.06.008. [Google Scholar]
- 21.Brown NF, Stefanovic-Racic M, Sipula IJ, Perdomo G. The mammalian target of rapamycin regulates lipid metabolism in primary cultures of rat hepatocytes. Metabolism. 2007;56:1500–7. doi: 10.1016/j.metabol.2007.06.016. doi: 10.1016/j.metabol.2007.06.016. [DOI] [PubMed] [Google Scholar]
- 22.Deepa SS, Walsh ME, Hamilton RT, Pulliam D, Shi Y, Hill S, et al. Rapamycin modulates markers of mitochondrial biogenesis and fatty acid oxidation in the adipose tissue of db/db mice. J Biochem Pharmacol Res. 2013;1:114–23. [PMC free article] [PubMed] [Google Scholar]
- 23.Stillman IE, Karumanchi SA. The glomerular injury of preeclampsia. J Am Soc Nephrol. 2007;18:2281–4. doi: 10.1681/ASN.2007020255. doi: 10.1681/ASN.2007020255. [DOI] [PubMed] [Google Scholar]
- 24.Alperovich G, Rama I, Lloberas N, Franquesa M, Poveda R, Gomà M, et al. New immunosuppressor strategies in the treatment of murine lupus nephritis. Lupus. 2007;16:18–24. doi: 10.1177/0961203306073136. doi: 10.1177/0961203306073136. [DOI] [PubMed] [Google Scholar]
- 25.Cohen EE, Wu K, Hartford C, Kocherginsky M, Eaton KN, Zha Y, et al. Phase I studies of sirolimus alone or in combination with pharmacokinetic modulators in advanced cancer patients. Clin Cancer Res. 2012;18:4785–93. doi: 10.1158/1078-0432.CCR-12-0110. doi: 10.1158/1078-0432. [DOI] [PMC free article] [PubMed] [Google Scholar]
- 26.Basso MD, Nambi P, Adelman SJ. Effect of sirolimus on the cholesterol content of aortic arch in ApoE knockout mice. Transplant Proc. 2003;35:3136–8. doi: 10.1016/j.transproceed.2003.10.050. doi: 10.1016/j.transproceed.2003.10.050. [DOI] [PubMed] [Google Scholar]
- 27.Tabatabai-Mir H, Sataranatarajan K, Lee HJ, Bokov AF, Fernandez E, Diaz V, et al. Rapamycin selectively alters serum chemistry in diabetic mice. Pathobiol Aging Age Relat Dis. 2012;2:1–4. doi: 10.3402/pba.v2i0.15896. doi: 10.3402/pba.v2i0.15896. [DOI] [PMC free article] [PubMed] [Google Scholar]
- 28.Das A, Durrant D, Koka S, Salloum FN, Xi L, Kukreja RC. Mammalian target of rapamycin (mTOR) inhibition with rapamycin improves cardiac function in type 2 diabetic mice: Potential role of attenuated oxidative stress and altered contractile protein expression. J Biol Chem. 2014;289:4145–60. doi: 10.1074/jbc.M113.521062. doi: 10.1074/jbc.M113.521062. [DOI] [PMC free article] [PubMed] [Google Scholar]
- 29.Roos S, Jansson N, Palmberg I, Säljö K, Powell TL, Jansson T. Mammalian target of rapamycin in the human placenta regulates leucine transport and is down-regulated in restricted fetal growth. J Physiol. 2007;582(Pt 1):449–59. doi: 10.1113/jphysiol.2007.129676. doi: 10.1113/jphysiol.2007.129676. [DOI] [PMC free article] [PubMed] [Google Scholar]
- 30.Anderl S, Freeland M, Kwiatkowski DJ, Goto J. Therapeutic value of prenatal rapamycin treatment in a mouse brain model of tuberous sclerosis complex. Hum Mol Genet. 2011;20:4597–604. doi: 10.1093/hmg/ddr393. doi: 10.1093/hmg/ddr393. [DOI] [PMC free article] [PubMed] [Google Scholar]
- 31.Franz DN, Leonard J, Tudor C, Chuck G, Care M, Sethuraman G, et al. Rapamycin causes regression of astrocytomas in tuberous sclerosis complex. Ann Neurol. 2006;59:490–8. doi: 10.1002/ana.20784. doi: 10.1002/ana.20784. [DOI] [PubMed] [Google Scholar]
- 32.Mischie A, Chanseaume S, Gaspard P, Andrei CL, Sinescu C, Schiariti M. Oral sirolimus: A possible treatment for refractory angina pectoris in the elderly. Int J Cardiol. 2016;5273:31601–11. doi: 10.1016/j.ijcard.2016.07.206. doi: 10.1016/j.ijcard.2016.07.206. [DOI] [PubMed] [Google Scholar]


