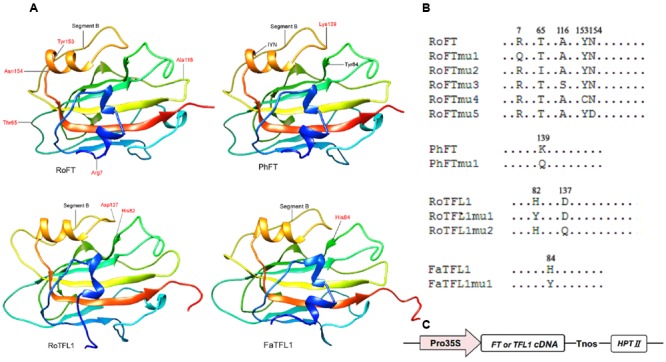
FIGURE 3.

Crystal structures of FT and TFL1 and maps of point mutated residues. (A) Cartoon diagrams of four FT or TFL1 homologs. The red high-lighted residues show the corresponding mutated points that were substituted for use in transgenic experiments. The protein pairs: RoFT/PhFT and RoTFL1/FaTFL1 present highly similar crystal structures to each other. (B) Diagram mapping the corresponding mutated amino acid residues of FT or TFL1 homologs. (C) Schematic map of the T-DNA region (vector pMOG22) used to perform the transgenic experiments.
