
FIGURE 4.
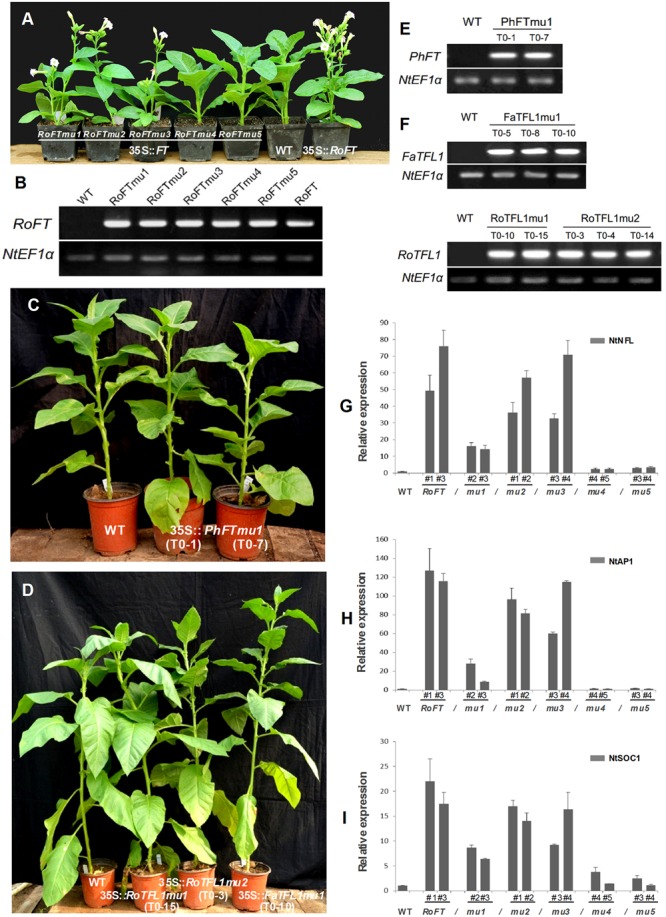
Phenotypic analysis of transgenic tobacco plants harboring different FT/TFL1 homologs. (A) From left to right, 35S::RoFTmu1-5, wild-type and 35S::RoFT plants, respectively, after growth for 45 days. (B) RT-PCR analysis to confirm the transgenic lines. (C) From left to right are wild-type, and transgenic plants harboring PhFTmu1 (two lines) after growth for 3 months. (D) From left to right are wild-type, transgenic plants harboring RoTFL1mu1, RoTFL1mu2, and FaTFL1mu1 after growth for 4 months. (E,F) RT-PCR analysis to confirm the transgenic lines. (G–I) qRT-PCR analysis of endogenous flowering genes in 45-day-old seedlings of transgenic and wild-type tobacco. The transcript levels of: (G) NtNFL, (H) NtAP1, and (I) NtSOC1 in different transgenic tobacco lines harboring various point mutations of FT. In this analysis, NtEF1α was used as a reference transcript. Three biological replications were performed randomly for each transgenic line.