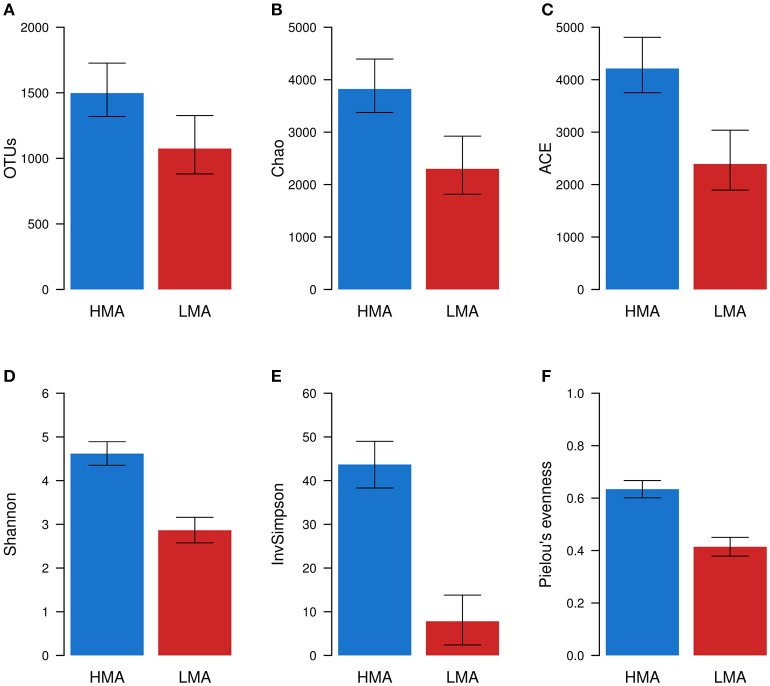
Figure 2.
Alpha diversity of HMA and LMA sponge samples. Richness (A–C) and diversity (D–F) metrics were calculated for each sample (n = 575) using rarefied OTU abundances. Estimated mean and 95% confidence intervals were obtained from linear mixed models of alpha diversity metrics. The effect of HMA-LMA status was tested with Likelihood ratio tests. In this procedure, two linear models with mixed effects were compared, the full model and the null model. All metrics were significantly greater (ANOVA, P ≤ 0.001) in the HMA than in the LMA group.

