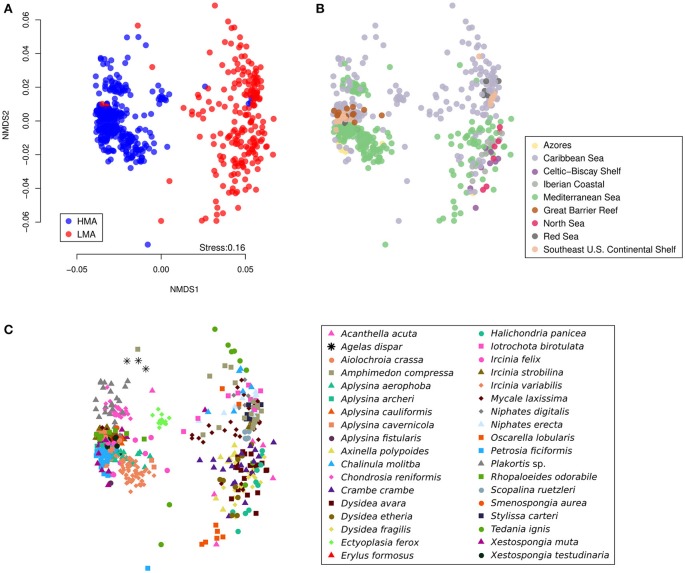
Figure 3.
Beta diversity of microbial communities associated with HMA and LMA sponge samples. NMDS was conducted from Bray–Curtis dissimilarities between samples based on OTU abundances. The three displayed plots represent the same analysis, where sample symbols and colors stand for (A) HMA-LMA status, (B) geographic region, and (C) host identity.

