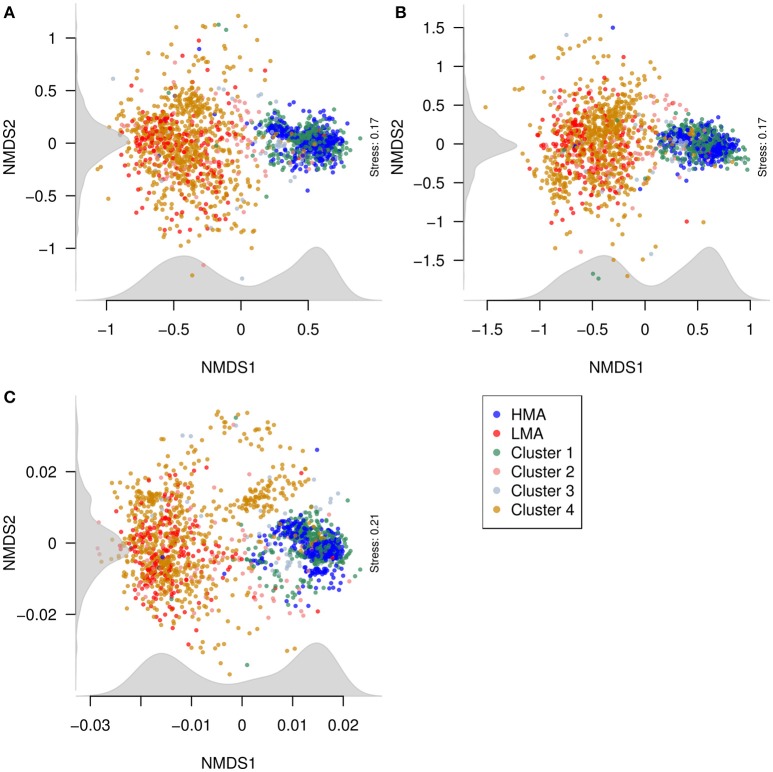
Figure 7.
Relationship between the structures of microbial communities (beta diversity) from classified and predicted sponges. NMDS plots were constructed from Bray–Curtis dissimilarities between samples obtained from (A) phylum, (B) class, and (C) OTU abundances. Points correspond to samples and are colored according to the HMA-LMA classification and to the clusters obtained from Random Forest prediction results (see Figure 6). Density of points along the NMDS dimensions (axes) was plotted in gray.

