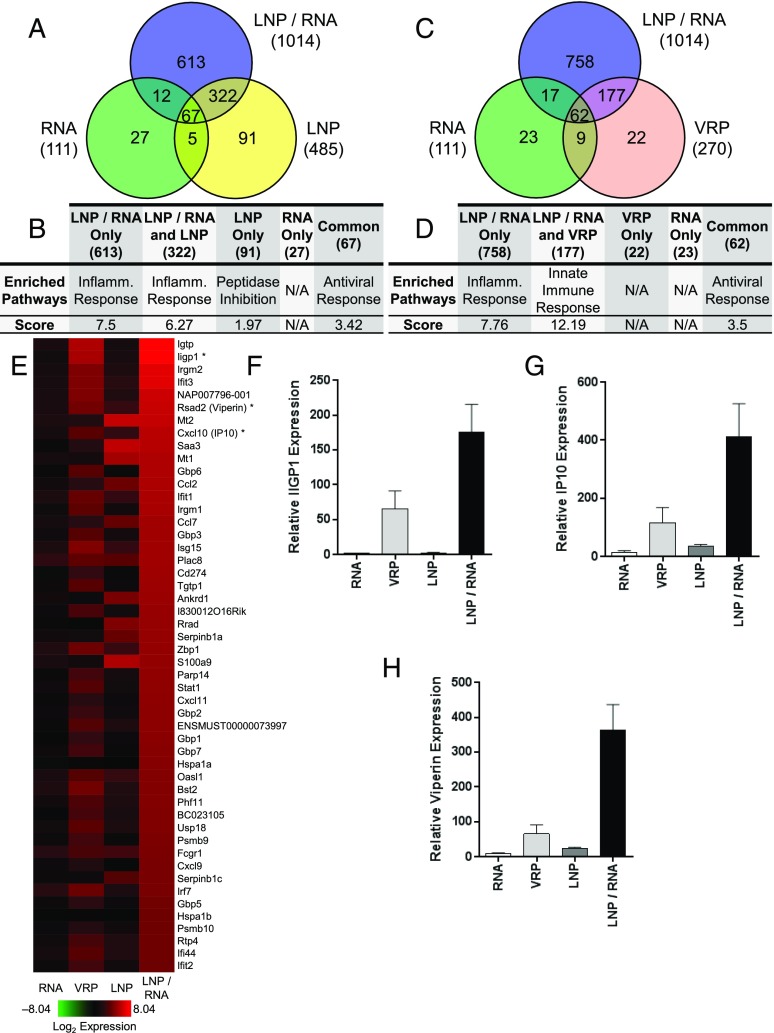
FIGURE 2.
Transcription profiles induced by indicated groups in mouse quadriceps. Genes with an average log2 ratio ≥2 or ≤2 compared with PBS-immunized mice and an adjusted p ≤ 0.05 were considered significant. (A and C) Venn diagrams illustrating the number of genes modulated by RNA alone, LNP/RNA, or LNP (A) or by RNA alone, LNP/RNA, or VRP. The total number of significantly dysregulated genes by each group is listed in parentheses. (B and D) Functional clustering analysis of individual Venn diagram regions (total number of genes in parentheses) from (A) and (C) was performed using the DAVID online database. The prominent enriched pathways and associated enrichment scores are listed. (E) Heat map of the 45 most highly expressed genes. (F–H) RT-PCR of IIGP1, IP10, and Viperin confirming microarray results [denoted by an asterisk (*) in (E)]. Each column represents the mean with the SEM from three different animals.

