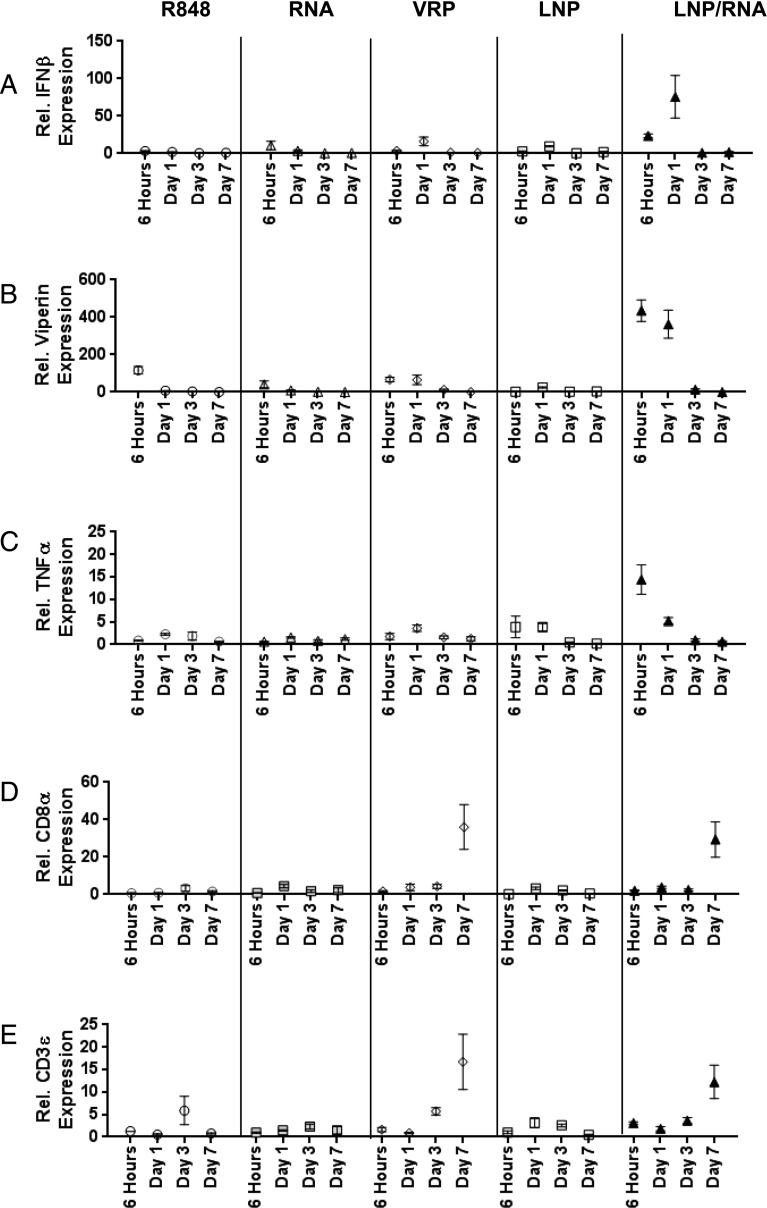
FIGURE 3.
RT-PCR time-course analysis of IFN- and T cell–associated genes. RNA harvested from mouse quadriceps after indicated vaccinations at 6 h, day 1, day 3, and day 7 was used for RT-PCR. Relative expression of IFN-β (A), Viperin (B), TNF-α (C), CD8α (D), and CD3ε (E) over PBS-injected mouse controls. Each dot represents the mean with SEM from three different animals.

