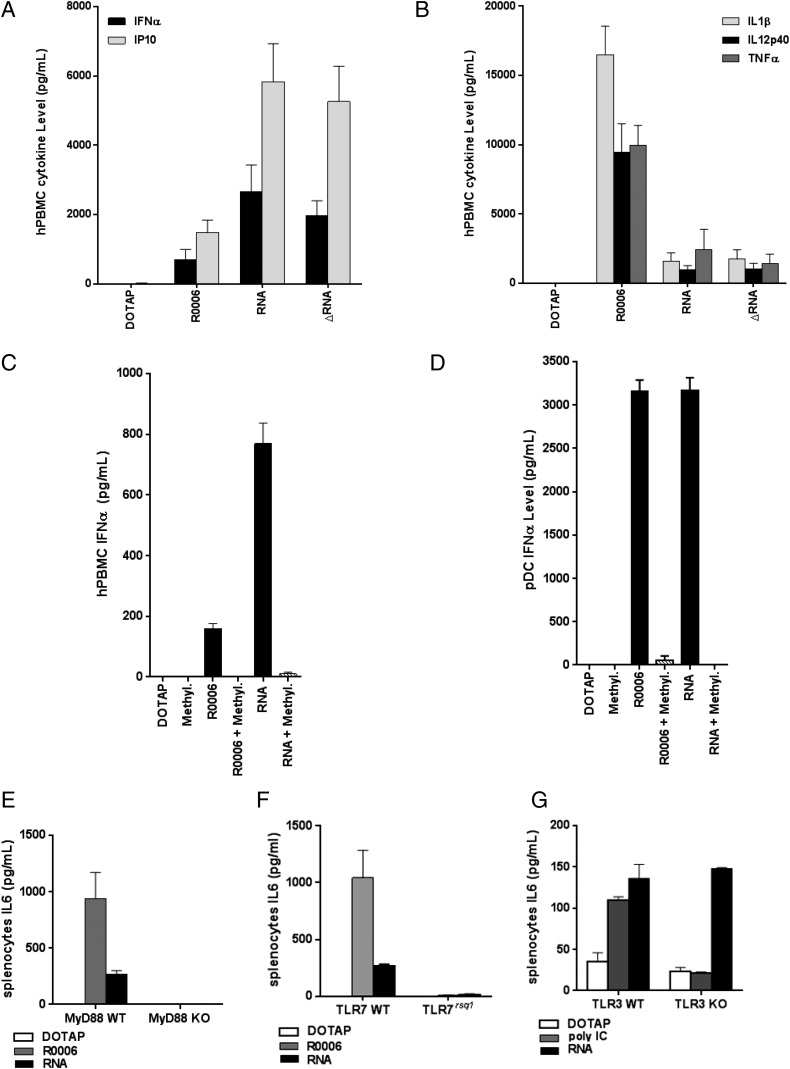
FIGURE 4.
Stimulation of hPBMCs with TLR agonists and RNA. IFN-related (A) and proinflammatory (B) cytokines induced after stimulation were measured using the mesoscale discovery platform. Each column represents the mean with SEM from six donors. IFN-α (C) in hPBMCs and IFN-α (D) in pDCs were evaluated as in (A) in the presence of methylated ssRNA. Each column represents the mean with SEM from two donors. Splenocytes from TLR7rsq1 (E), MyD88 KO (F), and TLR3 KO (G) were stimulated with the indicated TLR agonist or RNA, and IL-6 cytokines levels were measured 24 h later. Each column represents the mean with SEM from two different mice.

