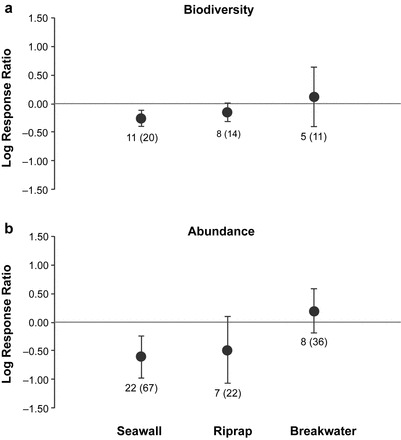
Figure 2.

Overall log response ratios between engineered-shore structures (seawall, riprap, breakwater) and natural shorelines for (a) biodiversity and (b) abundance. The error bars represent 95% confidence intervals and data labels show the number of studies and the total number of responses from the studies.
