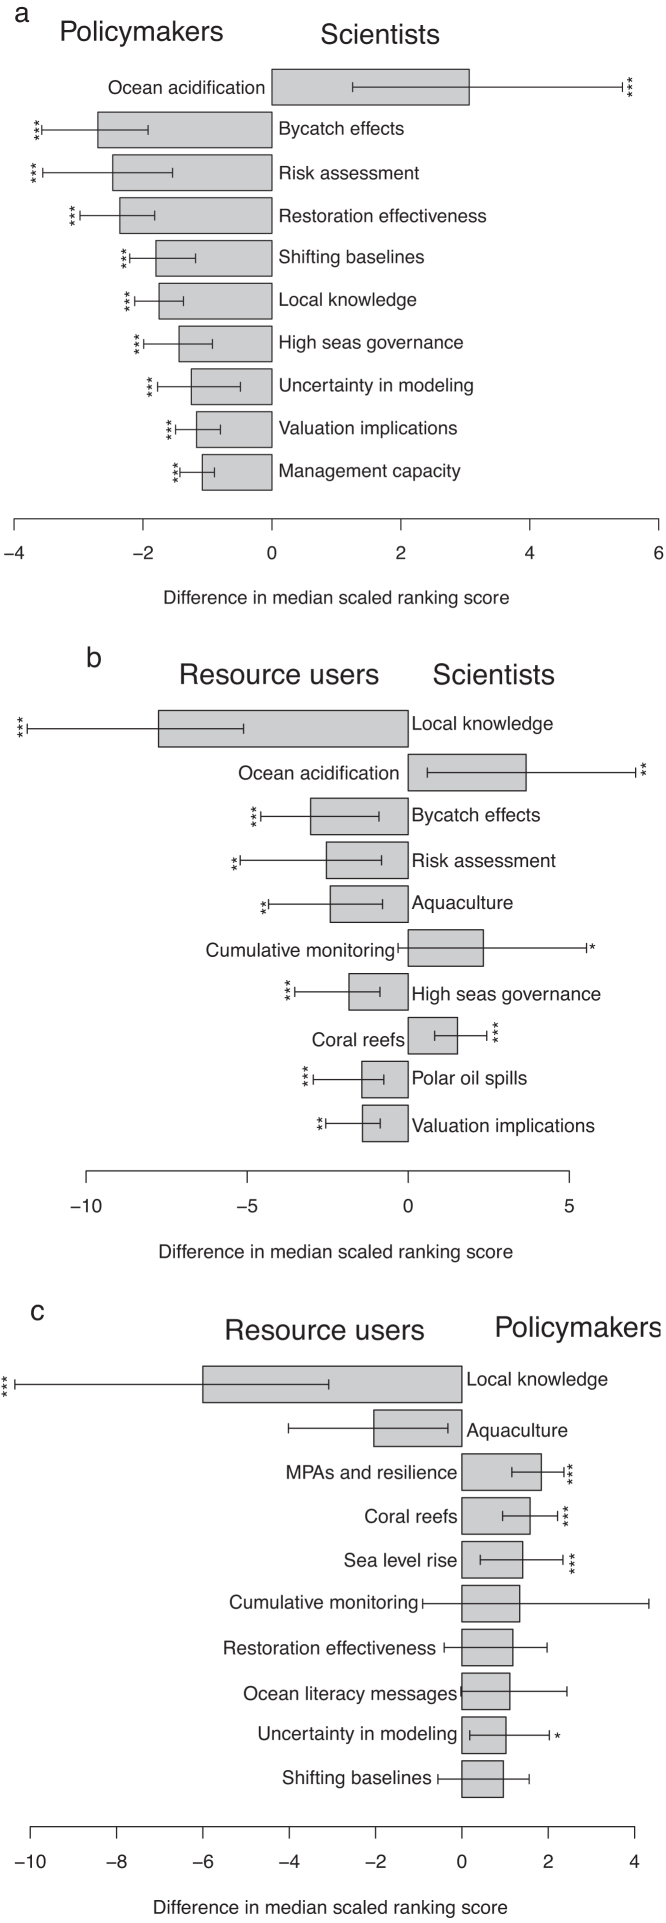
Figure 1.
The 10 questions with the biggest significant differences in median scaled ranking score among (a) scientists and policymakers, (b) scientists and resource users, and (c) policymakers and resource users are shown in decreasing order. The positive values indicate that scientists—or in (c), policymakers—had a higher median rank of that question. The error bars represent 95% confidence intervals based on bootstrapping with 1000 iterations. statistical significance is based on Bonferroni-adjusted p-values: *p < .05, **p < .01, ***p < .001. The questions with significant p-values but large error bars are likely a result of highly skewed distributions of question ranking scores.

