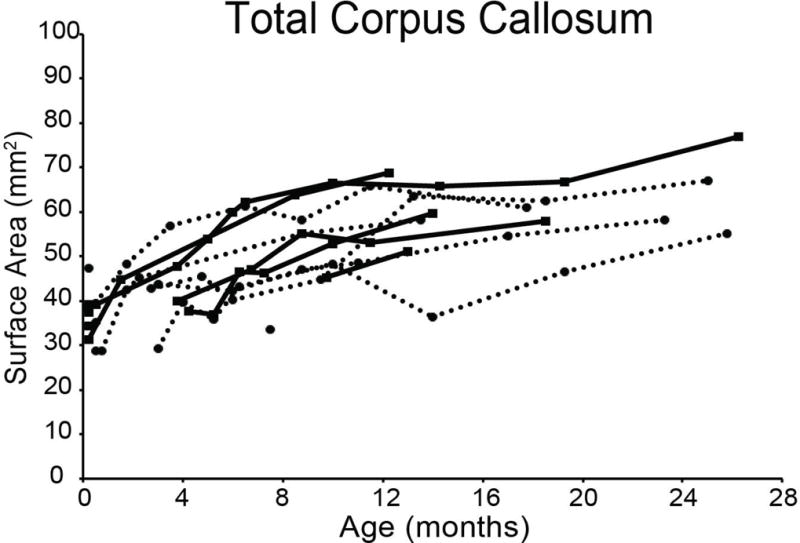
Figure 2. CC Surface Area as a Function of Age.

Scatterplot of raw surface areal measurements for the CC as a whole in squared millimeters as a function of age in months. Filled squares denote males and filled circles denote females. Lines between data points represent longitudinal measurements on the same animal for males (solid) and females (dashed).
