
Figure 3. Modeled Trajectories and Growth Rates.
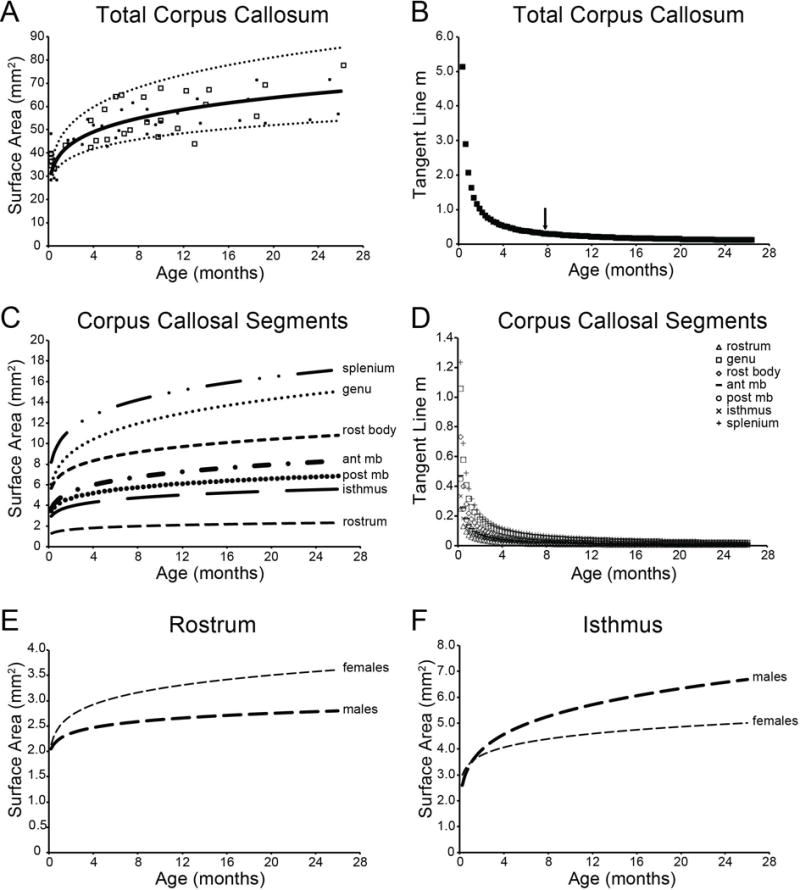
Top panels represent the modeled developmental trajectory (A) and tangent line slope values (B) for the modeled function for the total CC surface area. Individual surface areas are represented by open squares (males) and open circles (females). Arrow indicates the age at which differences between two adjacent data points did not substantially differ, and thus represents the approximate age at which growth leveled off. Middle panels represent the modeled developmental trajectory (C) and tangent line slope (m) values (D) for the modeled function for the individual callosal segments. Bottom panels represent the developmental trajectories modeled separately for males and females for the rostrum (E) and isthmus (F). All modeled trajectories include MSA to account for differences in overall brain size. rost body = rostral body; ant mb = anterior midbody; post mb = posterior midbody