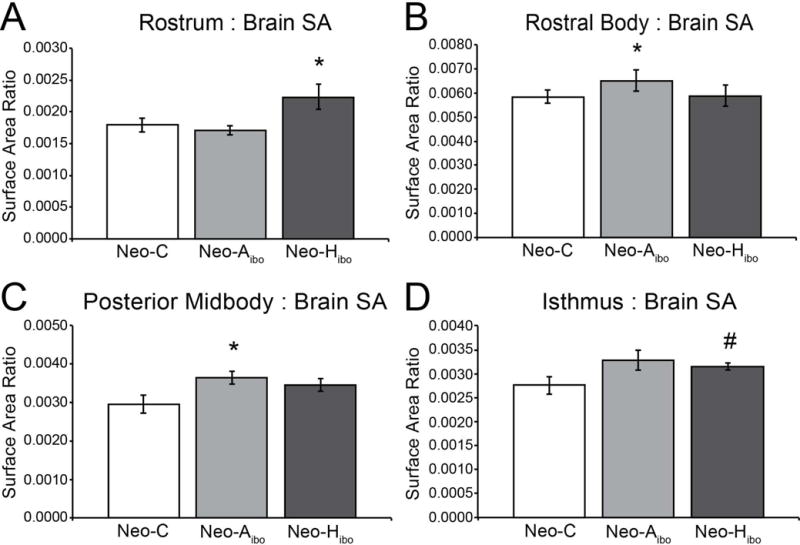
Figure 5. Surface Area of Segments by Group.

Average surface areas represented as a ratio between segment surface area and midsagittal surface are for group CONT (white bar), group NEO-Aibo (light grey bar) and group NEO-Hibo (dark grey bar) of the rostrum (A), rostral body (B), posterior midbody (D) and isthmus (E). Error bars denote standard error of the mean (SEM). *: p < 0.05; #: p < 0.08.
