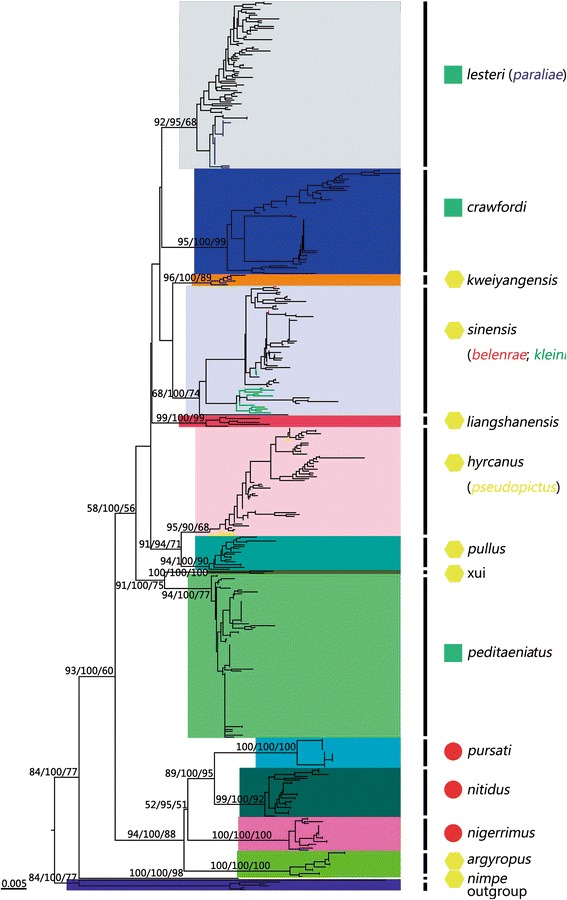
Fig. 1.

Neighbour joining tree based on COI sequences deposited in GenBank and our original data for the Hyrcanus Group. Bootstrap values (1 000 replicates, not shown for less than 50%) of Neighbour Joining, Bayesian, and Maximum likelihood analyses are shown above the main lineages, respectively. Lineage designation is indicated on the right. Branches representing COI sequences of An. belenrae, An. kleini, An. pseudopictus, and An. paraliae are indicated by red, green, yellow, and blue, respectively. The geometric shapes correspond to the different subgroups of the Hyrcanus Group, according to the classification of Harbach [4]. (green square) Lesteri Subgroup; (red circle) Nigerrimus Subgroup; (yellow hexagon) unclassified species. Bars represent 0.1 substitutions per site. An. lindesayi and An. claviger were used as outgroup taxa
