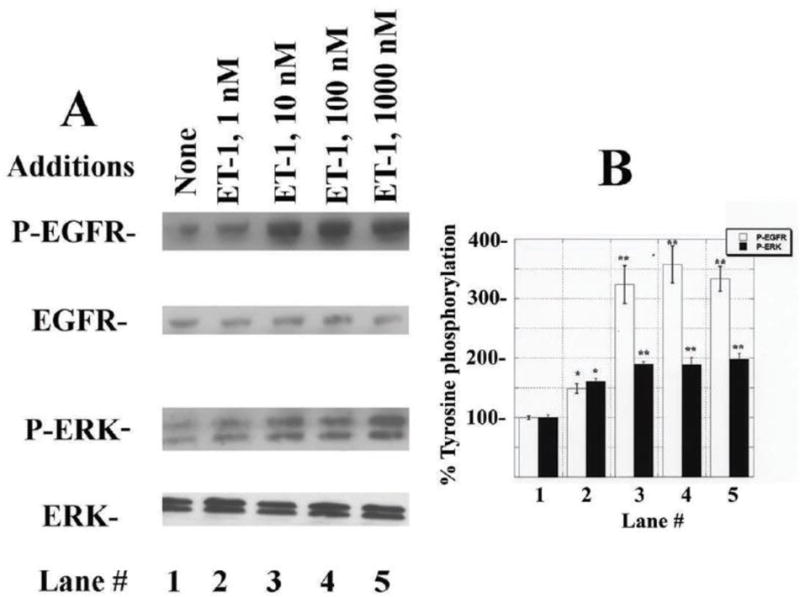
Fig. 3.

EGFR and ERK phosphorylation. (A) Addition of 1 nM ET-1 to NCI-H838 cells for 2 min moderately increased EGFR and ERK tyrosine phosphorylation, whereas 10, 100 or 1000 nM ET-1 strongly increased EGFR and ERK phosphorylation. (B) The mean % EGFR (□) and ERK (■) tyrosine phosphorylation ± S.D. is indicated for 3 determinations as a function of ET-1 concentration; p< 0.05, *; p < 0.01, ** relative to control by ANOVA.
