
Fig. 6.
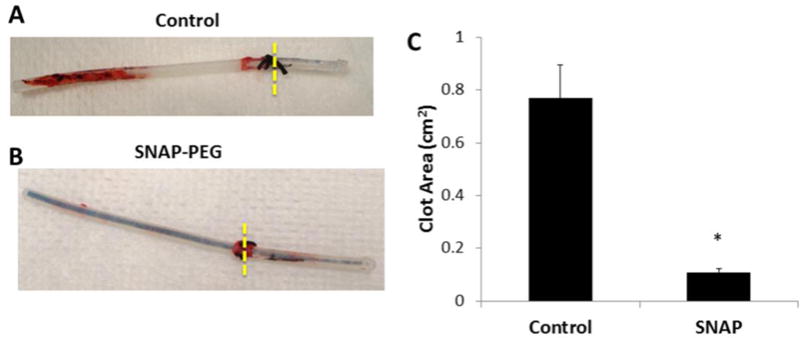
Representative images of single lumen catheters filled with PEG control (A) or 40 wt% SNAP-PEG (B) after implantation in rabbit veins for 7 h. Two-dimensional representation of thrombus formation on the catheters was quantitated using ImageJ software (C). Data represents the mean ± SEM (n=4). * p < 0.05, SNAP-PEG vs. Control.