
Fig. 7.
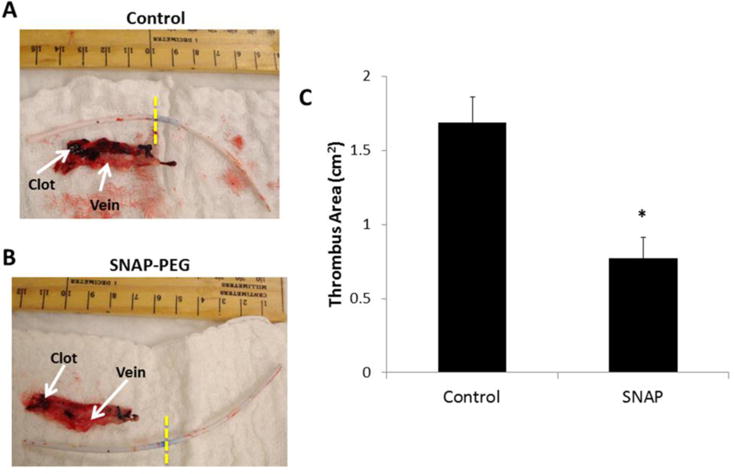
Representative images of thrombus formation (dark red clots in veins) on dual lumen catheters and vein interior after 11 d implantation in rabbit veins, where catheter left of yellow dashed lines was in the vein. The dark reddish-black areas are thrombus formed, and the red tissue is the explanted vein that the catheter was inserted within. The vascular access lumen was locked with saline, and the other lumen was filled with PEG control (A) or 40 wt% SNAP-PEG (B). Two-dimensional representation of thrombus formation was quantitated using ImageJ software (C). Data is the mean ± SEM (n=4). * p < 0.05, SNAP-PEG vs. Control.