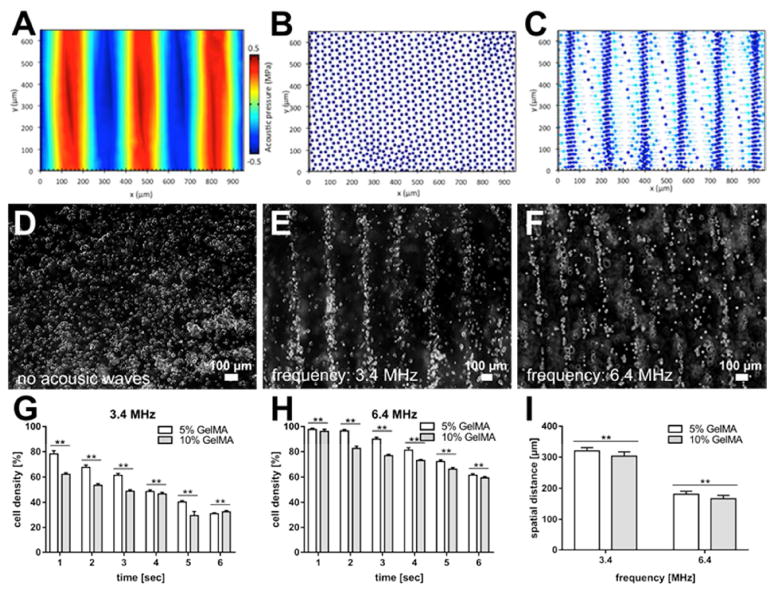
Figure 4.

(A-C) The results of the simulation, top view, corresponding to the “C-C” view as defined and shown on Figure 2E: A) Pressure field resulted from SSAWs and correspond patterning of cells after B) zero and C) 1 seconds. (D-F) Microscope images of patterned cardiac fibroblast cells at day 1. Assembly time for the samples was 1.2 seconds: D) Random distribution of cells before acoustic is applied; E) Cardiac fibroblast cell alignment at 3.4MHz; F) Cardiac fibroblast cell alignment at 6.4MHz; G and H) The scattering rate of the cellular density associated with the formed patterns, subsequent to ARF, without UV crosslinking. The plots are obtained for two different frequencies (3.4 MHz in (G) and 6.4 MHz in (H)); I) Variation of the spatial distance between the patterned cellular lines, as influenced by the changes made to the SAWs frequencies and GelMA pre-polymer concentrations.
