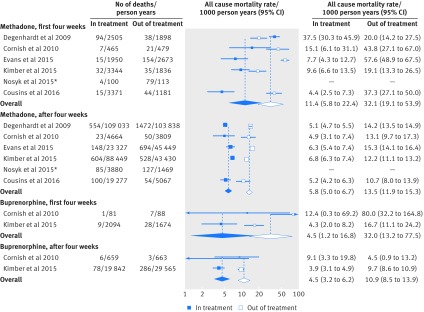
Fig 4 All cause mortality rates by time interval in and out of opioid substitution treatment with methadone or buprenorphine and pooled all cause mortality rates, 2009-16. Mortality data were disaggregated into first four weeks and remaining follow-up in and out of treatment in all cohort studies except Degenhardt et al,6 which reported mortality before and after two weeks of treatment initiation and cessation. High risk cohort of Nosyk et al36 (injectors positive for HIV receiving highly active antiretroviral therapy) was excluded from meta-analysis. Area of each square is proportional to study weight in meta-analysis. Horizontal lines represent exact 95% confidence intervals based on Poisson distribution. Diamonds represent pooled all cause mortality rates before and after four weeks in and out of treatment across methadone or buprenorphine cohorts estimated from multivariate random effects meta-analysis on log transformed rates in four time-by-treatment intervals

An official website of the United States government
Here's how you know
Official websites use .gov
A
.gov website belongs to an official
government organization in the United States.
Secure .gov websites use HTTPS
A lock (
) or https:// means you've safely
connected to the .gov website. Share sensitive
information only on official, secure websites.
