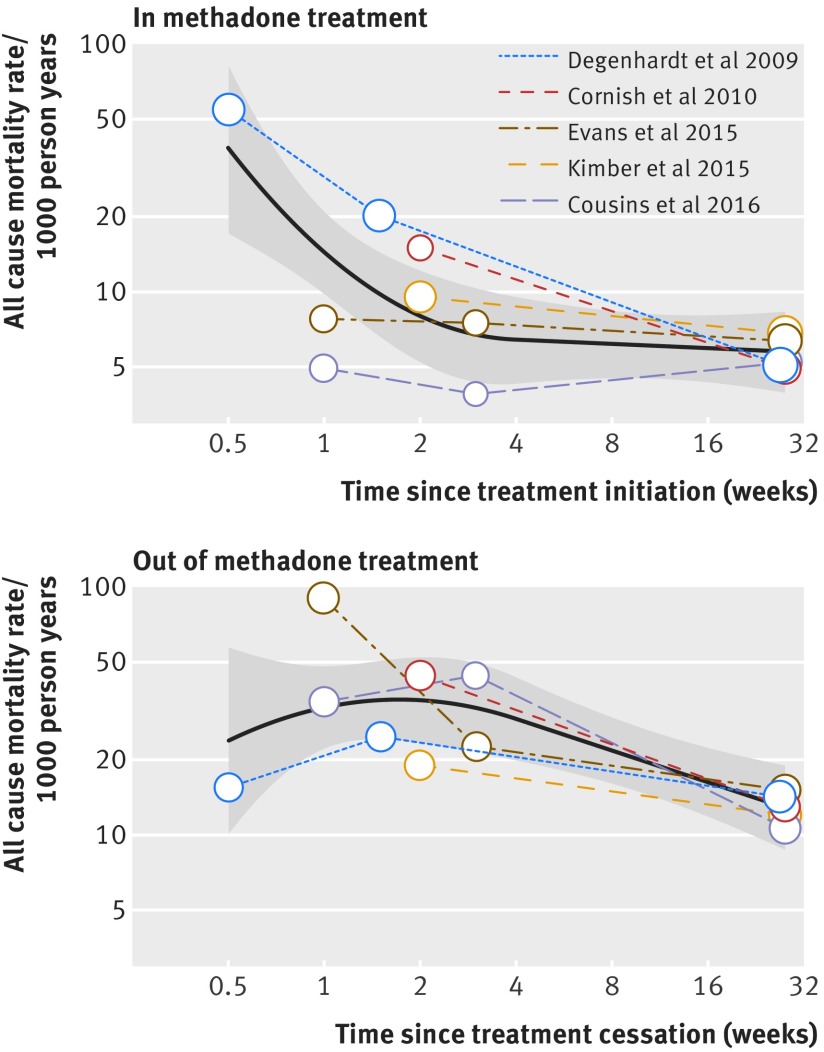
Fig 5 All cause mortality rates by time since treatment initiation and cessation in methadone cohorts and pooled all cause mortality risk trends, 2009-16. High risk cohort of Nosyk et al36 (injectors positive for HIV receiving highly active antiretroviral therapy) was excluded from meta-regression. Area of each circle is proportional to weight of each time interval in meta-regression. Pooled trends in all cause mortality risk (solid lines) and their 95% confidence intervals (shaded regions) over time in and out of methadone treatment were estimated from bivariate random effects meta-regression of log transformed rates on quadratic linear spline function of log time with knot at four weeks

An official website of the United States government
Here's how you know
Official websites use .gov
A
.gov website belongs to an official
government organization in the United States.
Secure .gov websites use HTTPS
A lock (
) or https:// means you've safely
connected to the .gov website. Share sensitive
information only on official, secure websites.
