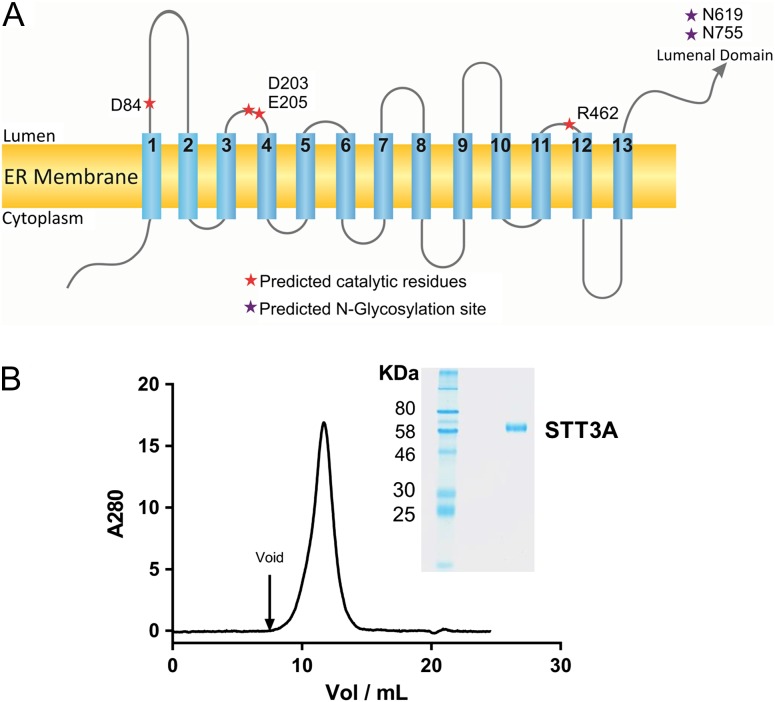
Fig. 1.
(A) Schematic representation of the predicted transmembrane topology of TbSTT3A. The positions of the expected catalytic residues based on sequence alignment with PglB are shown as red asterisks. Purple asterisks depict the two glycosylation sites in the luminal domain of TbSTT3A (N619 and N765). (B) SEC and SDS-PAGE analysis of purified TbSTT3A. 85 µg of purified and deglycosylated TbSTT3A were loaded on a Superdex S200 column at 0.5 mL/min. SDS-PAGE analysis of purified TbSTT3A is shown in the inset. 1.7 µg of purified TbSTT3A was loaded on a 10% polyacrylamide gel. A single band is observed for the purified protein. This figure is available in black and white in print and in color at Glycobiology online.

