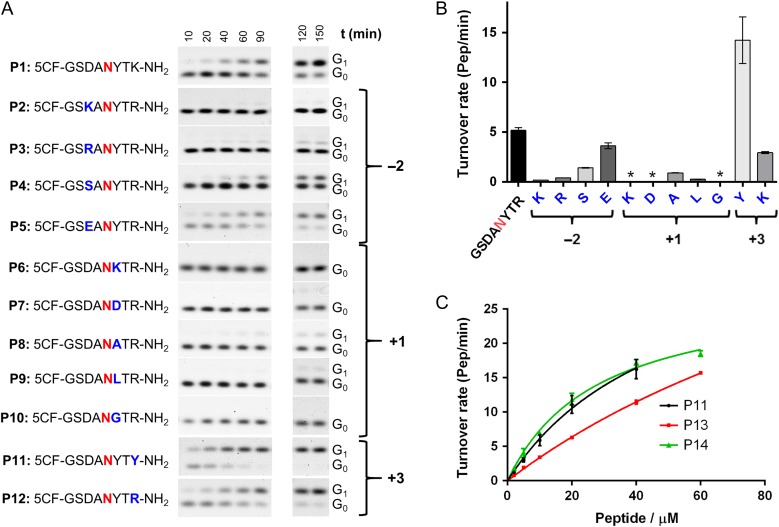
Fig. 2.
Optimization of the acceptor peptide sequence. (A) Synthetic acceptor peptides are shown in single letter code. The acceptor asparagine (zero position of the sequon) is indicated in red. Glycosylation experiments were performed and the fluorescently labeled substrate (G0) and product (G1) were quantified following Tricine SDS-PAGE analysis. (B) Turnover rates after fitting the time points by linear regression using PRISM. Error bars indicate standard error of the fitting. (C) Kinetic analysis of substrate peptides: glycosylation experiments were performed with 20 nM purified TbSTT3A, 50 µM farnesyl-PP-chitobiose, 10 mM MnCl2, 150 mM NaCl, 20 mM Hepes pH 7.5, 0.035% DDM, 0.007% CHS and different concentrations of peptides varying from 2 to 60 µM. Data points reflect the mean of three separate measurements. Error bars indicate standard deviations. Data were fitted by nonlinear regression according to the Michaelis–Menten formula using PRISM. This figure is available in black and white in print and in color at Glycobiology online.

