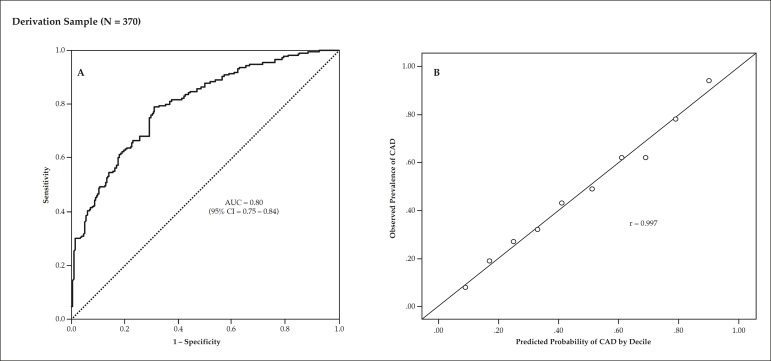
Figure 2 .
Analysis of the model's discrimination and calibration in the derivation sample of 370 patients. Panel A shows significant AUC of the probabilistic model for prediction of obstructive coronary artery disease. Panel B shows a significant correlation between predicted and observed probability of coronary artery disease (CAD). AUC denotes area under the receiver operating characteristic curve.

