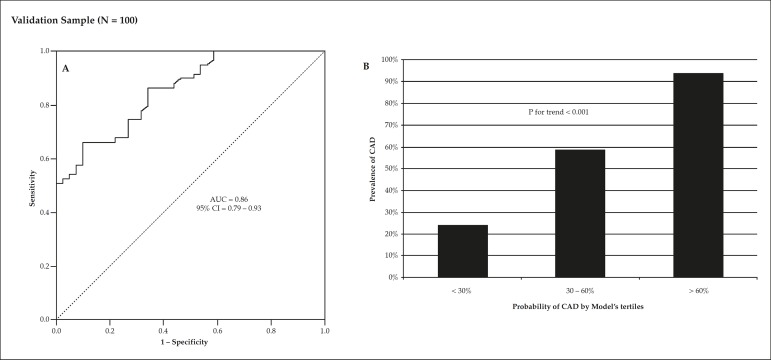
Figure 3.
Analysis of the model's performance in the independent validation sample of 100 patients. Panel A shows a significant AUC of the probabilistic model for prediction of obstructive coronary artery disease (CAD). Panel B indicates a progressive increase in the prevalence of CAD according to tertiles of the model's prediction. AUC denotes area under the receiver operating characteristic curve.

