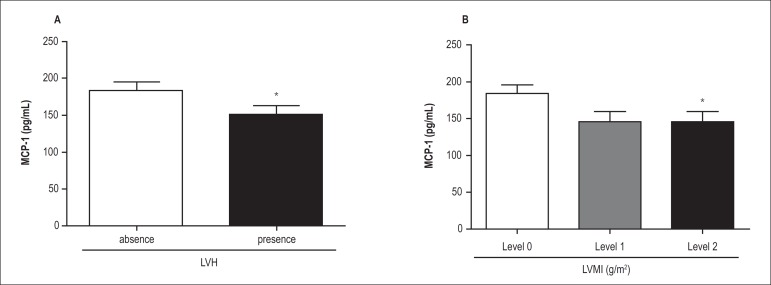
Figure 2.
Plasma MCP-1 levels according to (A) presence (n = 96) or absence (n = 94) of left ventricular hypertrophy (LVH; cut-off value of 115 g/m2 for men and 95 g/m2 for women) and (B) level of LVH in all hypertensive subjects (with resistant hypertension and mild-to-moderate hypertension): level 0 = patients without LVH (left ventricular mass index [LVMI] < 115 g/m2 in men and < 95 g/m2 in women); level 1 = patients with LVH and LVMI levels < 121 g/m2; and level 2 = patients with LVMI levels ≥ 121 g/m2. Values are expressed as mean ± standard deviation (SD). (A) *p = 0.005 compared with the absence of LVH and (B) *p = 0.01 compared with level 0.

