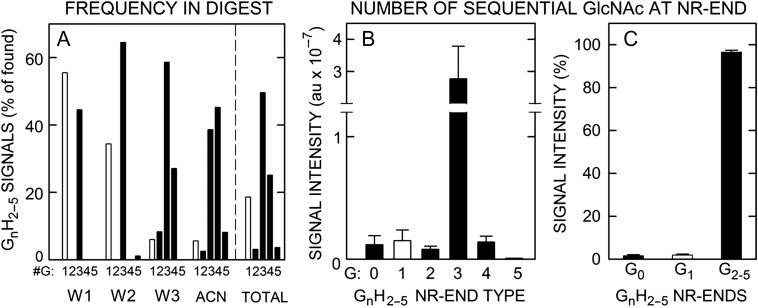
Fig. 11.
The apparent stoichiometry of chitin-oligo NR-ends in SeHAS HA is 0.97. (A) GnHn oligos show different distributions and abundance patterns during fractionation of lyase digests of SeHAS HA (Table II). The frequencies of finding a GnH2–6 series member containing 1 (white bars) or 2–5 (black bars) GlcNAc residues (G), as indicated, is shown as a percent of all the candidate m/z signals observed in the Wash 1 (W1), Wash 2 (W2), Wash 3 (W3) and ACN fractions (n = 5–8). The summary numbers (totals to right of vertical dashed line) were then calculated from these values as an average of the observed number- and weight-average signal frequencies. The most readily detected species were G3H2–5 (50%), G4H2–5 (25%), and G1H2–5 (19%; uncorrected for lyase over-production) with G2H2–5 and G5H2–5 each at 3%. (B) LRR values and calculated theoretical m/z signal intensities in the original digests, determined as in Figure 10, are shown for G0–5 NR-end types with 2–5 HA disaccharide units (H); G1 (white bar) and G0,2–5 (black bars). Values are mean signal intensity ± SEM (n = 4) in arbitrary units (au). (C) Chitin-HA oligos (i.e. G2–5H2–5) account for 96.5% of the total signal intensity of all NR-end fragments identified and quantified (as in B); G0H2–5 and G1H2–5 were 1.6 and 1.9% of total signal intensity, respectively. Values are mean percent ± SEM (n = 4) of total LRR signal intensity. Based on the 14-fold over-estimation of G1H2–5 species in lyase digests (Table IV), these initial values were reduced 10-fold (90%) in (B) and (C).

