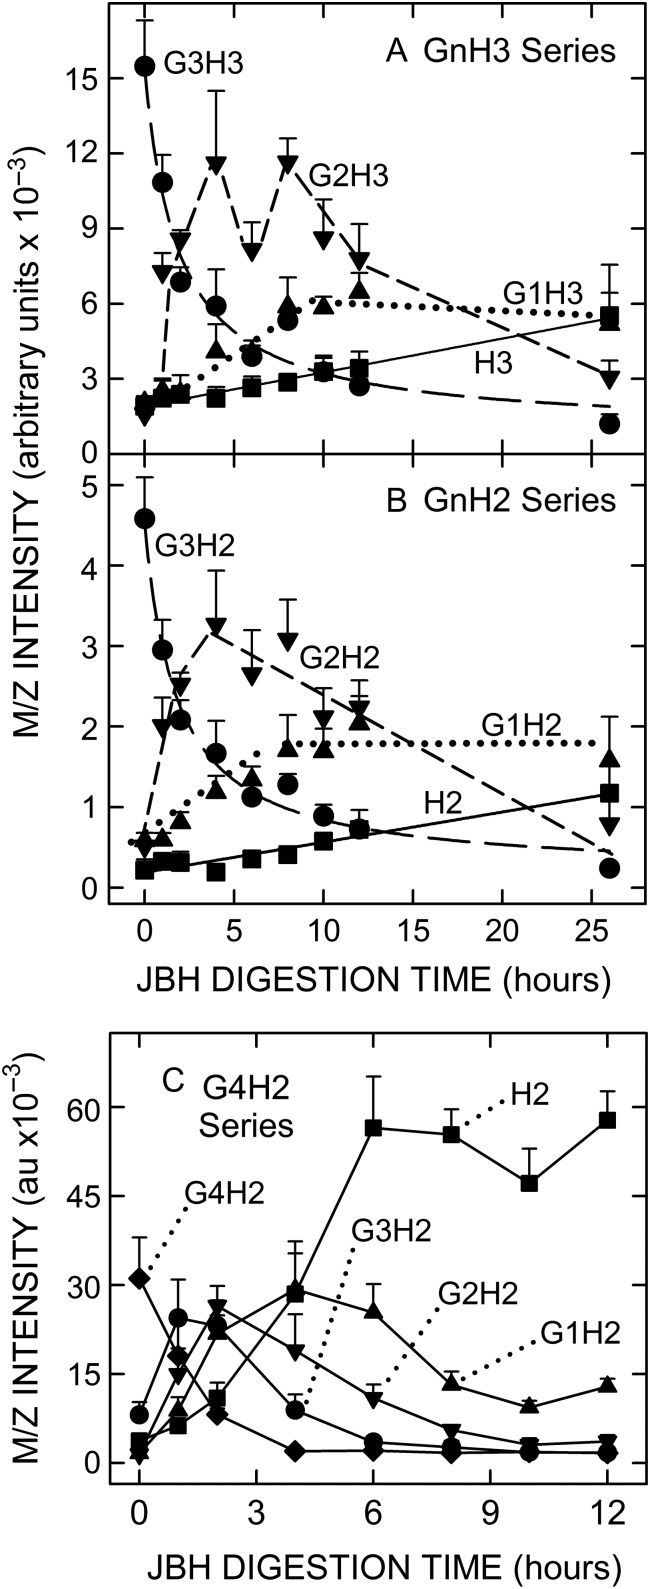
Fig. 6.
Kinetic changes during JBH treatment show that G3H2 and G3H3 species from SeHAS HA are sequentially converted to smaller members of the H2 and H3 series. Aliquots (5 µL) of Wash 3 were incubated with 22 µL inactive (time-zero) or active JBH at 30°C for up to 26 h (n = 4 except n = 3 at 26 h); values are the mean intensity ± SEM as indicated. Members of the G0–3H3 (A) and G0–3H2 (B) series were analyzed to monitor decreases or increases in each member as a function of increasing JBH digestion time, (G3H2,3, ●; G2H2,3, ▼; G1H2,3, ▲; G0H2,3, ■). Lines (r2 ≥ 0.97) for H2,3 (solid) and G3H2,3 (long dash) were calculated by linear regression or a 3-parameter hyperbolic decay function, respectively, using Sigma Plot v10. Lines for G2H2,3 (short dash) and G1H2,3 (dotted) are comprised of linear segments. (C) ACN fraction samples (10 μL) containing G4H2 and much less or no smaller members of this GnH2 series were incubated for up to 12 h, as indicated, with 22 µL of inactive (time-zero) or active JBH. Sequential and time-dependent changes in the levels of G3H2, G2H2, G1H2 and H2 are evident.

