Fig. 6.
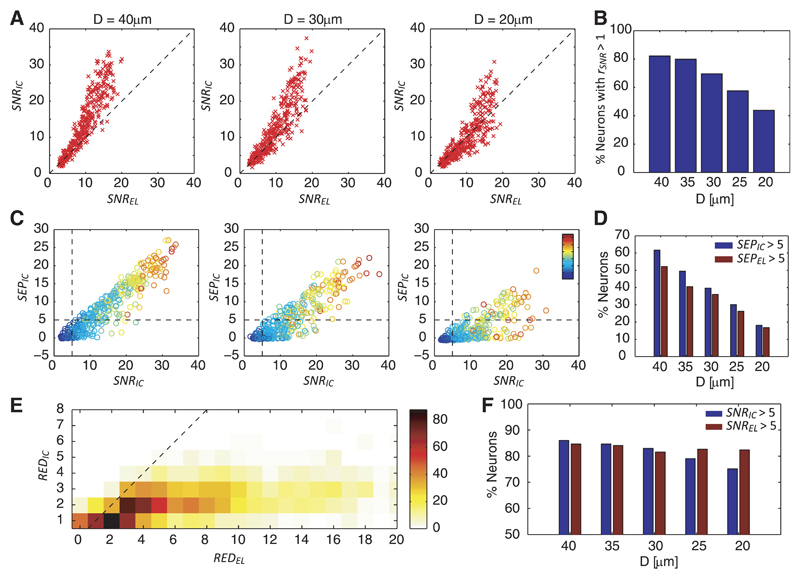
A: signal-to-noise-ratio (SNR) conditions for electrodes (SNREL) vs. ICs (SNRIC) for simulated neurons (red crosses) of 3 different configurations. The dashed line shows SNREL = SNRIC. B: percentage of neurons, for which SNRIC > SNREL for the 5 configurations. C: SNR vs. separability for neurons of 3 different configurations. The dashed lines indicate threshold values for separability of neurons (SEPIC = 5 and SNRIC = 5). The color code indicates the template energies. D: percentage of neurons with SEPIC > 5 (blue) and SEPEL > 5 (red). E: histogram showing the counts of redundancies REDEL and REDIC for a total of 1,130 neurons (330 neurons having REDIC = 0 were excluded from the graphic representation). The dashed line indicates REDEL = REDIC. F: percentage of neurons that can be detected according to the criteria SNRIC > 5 (blue) and SNREL > 5 (red) for the 5 configurations.

