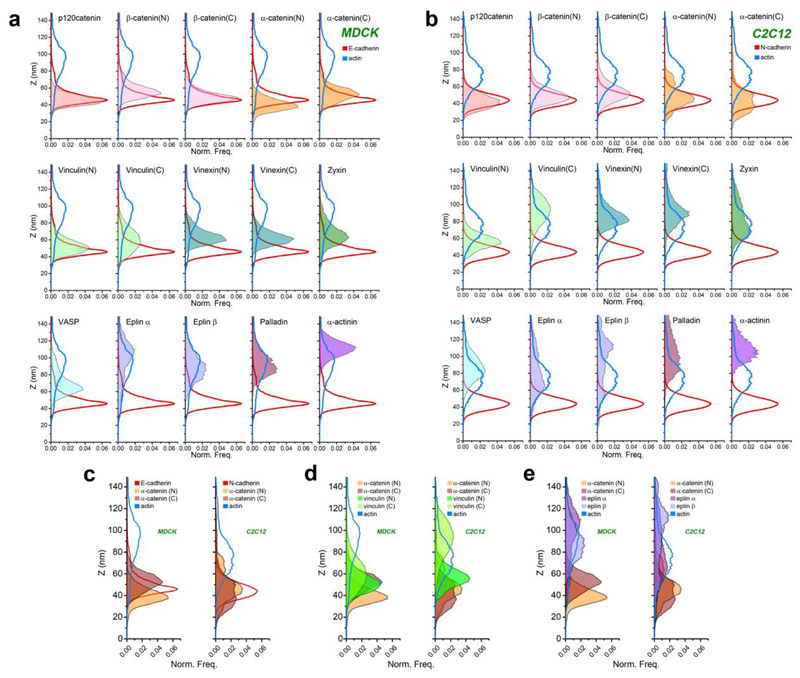
Figure 3. Z-dimension profiles of cadhesome proteins.
Normalized histogram of pixel z-position of indicated proteins (filled colors) in MDCK (a) and C2C12 (b) cells, relative to E- or N-cadherin (solid red) f-actin (solid blue). Integrated areas under each histogram are normalized to unity, such that each histogram reflects the probability distribution of locating a given protein as a function of z-position. c, d, e Comparison of protein z-profiles of c) α-catenin (N and C-terminal probes, shades of brown) and d) vinculin (N and C-terminal probes shades of green), or e) Eplins (α and β isoforms, shades of purple) between MDCK and C2C12 cells.

