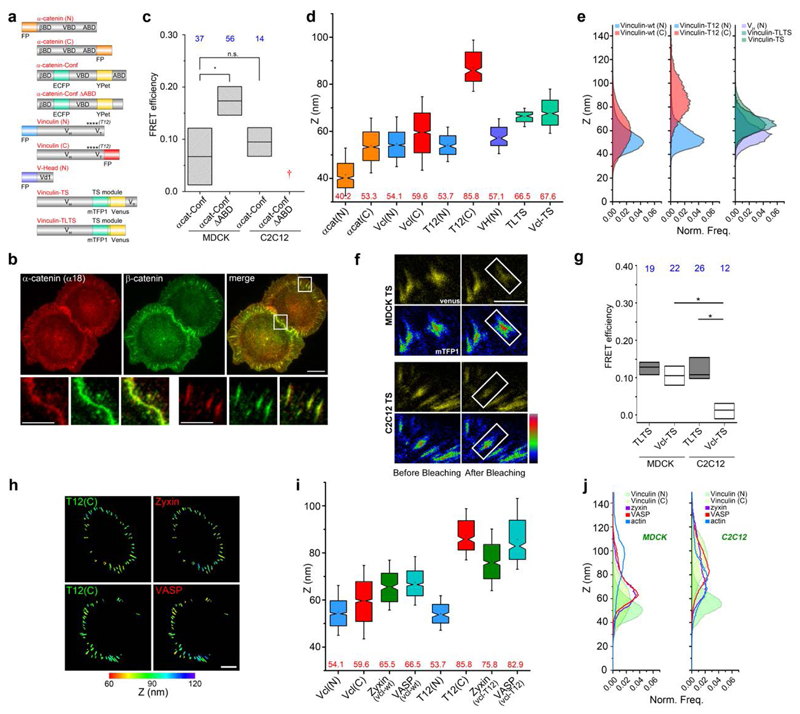
Figure 4. Nanoscale positions and conformations of vinculin and α-catenin in cadherin-based adhesions.
a, Diagrams for α-catenin and vinculin probes. FP: fluorescent protein (orange: α-catenin FP probes; blue, vinculin N-terminus; red, vinculin C-terminus); α-catenin-conf: α-catenin conformation sensor (teal: ECFP, yellow: YPet); α-catenin-conf ∆ABD: α-catenin conformation sensor with actin binding domain deletion; βBD, VBD, ABD: binding sites on α-catenin for β-catenin, vinculin, and actin, respectively; VH, VT, Vd1: vinculin head-domain, vinculin tail-domain, and the d1 sub-domain of VH, respectively; ****: approximated positions of point-mutations; vinculin-TS (Vcl-TS): vinculin tension-sensor (teal: mTFP1, yellow: Venus); vinculin-TLTS: Tail-less vinculin-TS. b, Immunofluorescence for activated α-catenin (α18) (red) and β-catenin (green) in MDCK cells on E-cadherin substrate. Bottom row, insets zoom-in: native cell-cell contacts and planar cadherin adhesions. Scale bars: 10 μm (insets: 5 μm). c, FRET efficiency of α-cat-conf and α-cat-conf ∆ABD. †: construct did not localise in C212. d, Box plots for zcentre of α-catenin and vinculin FP probes in MDCK. e, Z-profiles of vinculin probes in MDCK. N-terminal (blue), C-terminal (red), vinculin–TS and vinculin-TL-TS (shades of teal), vinculin head domain (VH, residue 1-258, purple) probes. f, FRET measurement of intra-vinculin tension. (Top) MDCK cells, (bottom) C2C12 cells expressing vinculin-TS, on E- or N-cadherin substrate, respectively. Rainbow look-up table (color bar) used for donor channel (mTFP1). Scale bar: 5 μm. g, FRET efficiency in MDCK and C2C12. h, Vinculin conformation modulates position of zyxin and VASP. Topographic map of z-positions: (left) vinculin-T12 C-terminal, (right) zyxin or VASP, co-expressed in MDCK cells. Color bar: z-position relative to substrate surface. Scale bar: 10 μm. i, Box plots for zcentre of vinculin, zyxin, and VASP (green and teal), with wild-type vinculin (Vcl-wt) or vinculin-T12. j Comparison of protein z-profiles for vinculin (N- and C- terminal probes, shades of green), and zyxin (purple) and VASP (red), overlay with f-actin z-profile (blue), between MDCK and C2C12 cells. c, g: Box plots for FRET efficiency (acceptor photobleaching): median, 1st and 3rd quartiles. *: p-value < 0.05. Number of cells (n values) in blue. d, i: Notched box plots: first and third quartiles, median and confidence intervals; whiskers, 5th and 95th percentiles, with n values (number of adhesions) in Supplementary Table 3.

